Evaluate a Pitcher's Repertoire
Break down a pitcher's arsenal by examining usage, location, and performance for each pitch type. In this example, we'll evaluate Gerrit Cole's repertoire using TruMedia's pitching Overview charts and Splits tab.
Difficulty: Intermediate · Estimated time: 5–10 minutes
Prerequisites
- Access to the MLB demo site
- Familiarity with basic navigation (player pages, tabs)
What You'll Learn
- How to view pitch frequency, heat maps, and hit charts on the Overview tab
- How to read per-pitch-type splits on the Splits tab
- How to interpret traditional pitching stats broken down by pitch type
Step 1: Navigate to a pitcher's stats page
Go to a pitcher's individual pitching stats page. In this example, we'll analyze Gerrit Cole's full repertoire across all available seasons.
You can reach any pitcher's page by searching for their name in the search bar at the top of any page, or by clicking their name on a leaderboard or roster.

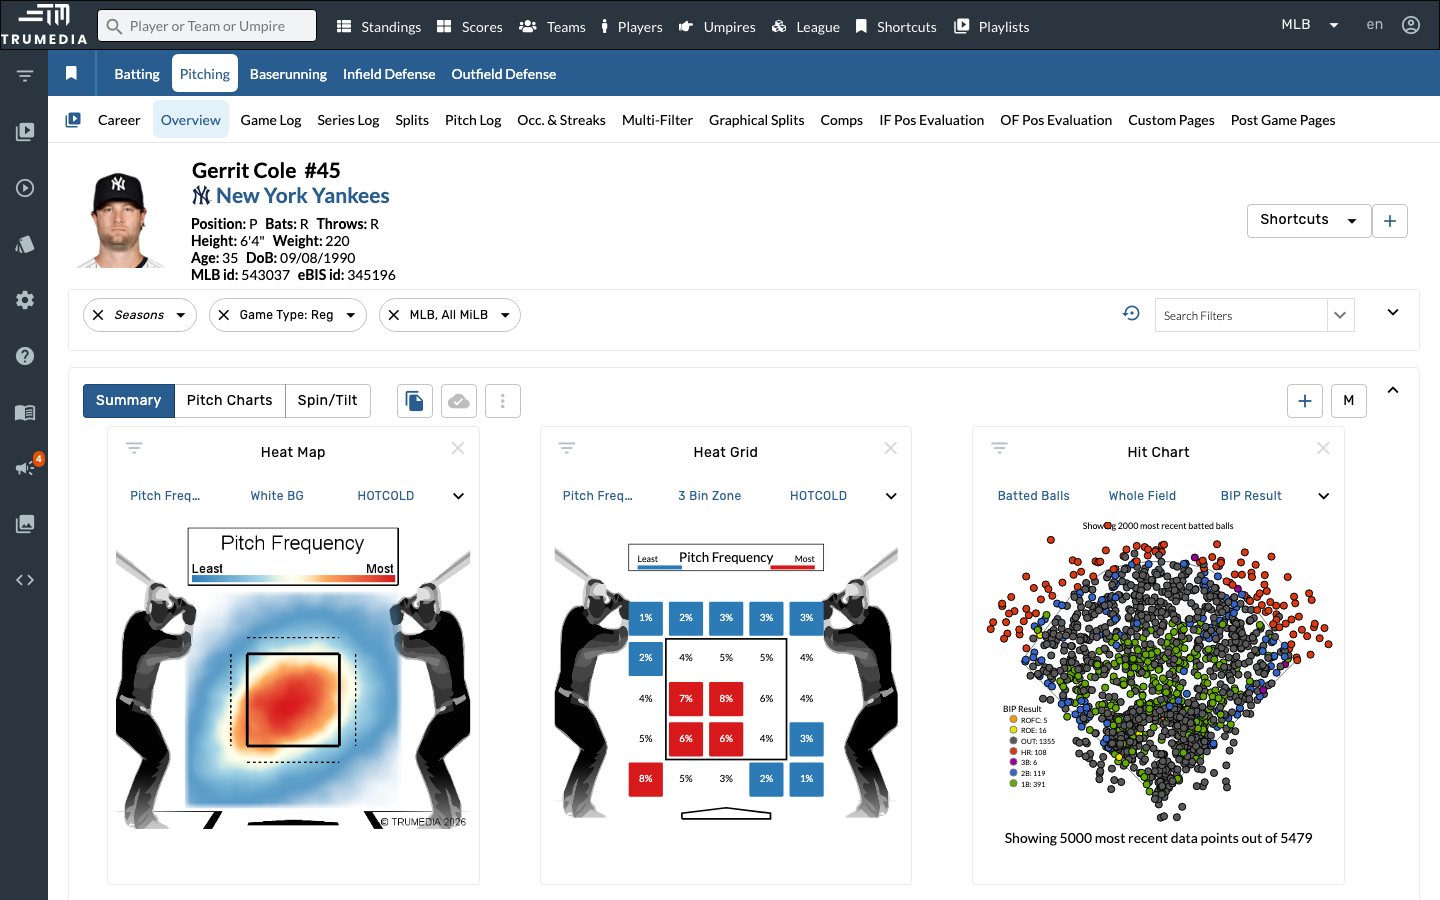
Step 2: View the Overview charts
The Overview tab displays three side-by-side chart panels that give you an immediate visual read on the pitcher's tendencies:
Heat Map (left) shows pitch location density — red areas indicate where the pitcher throws most frequently. Heat Grid (center) breaks the strike zone into cells with exact frequency percentages. Hit Chart (right) plots batted ball outcomes across the field, color-coded by result type.
Toggle between Pitch Frequency, White Background, and HOTCOLD views on the Heat Map, and between different zone breakdowns on the Heat Grid to see different aspects of the location profile.
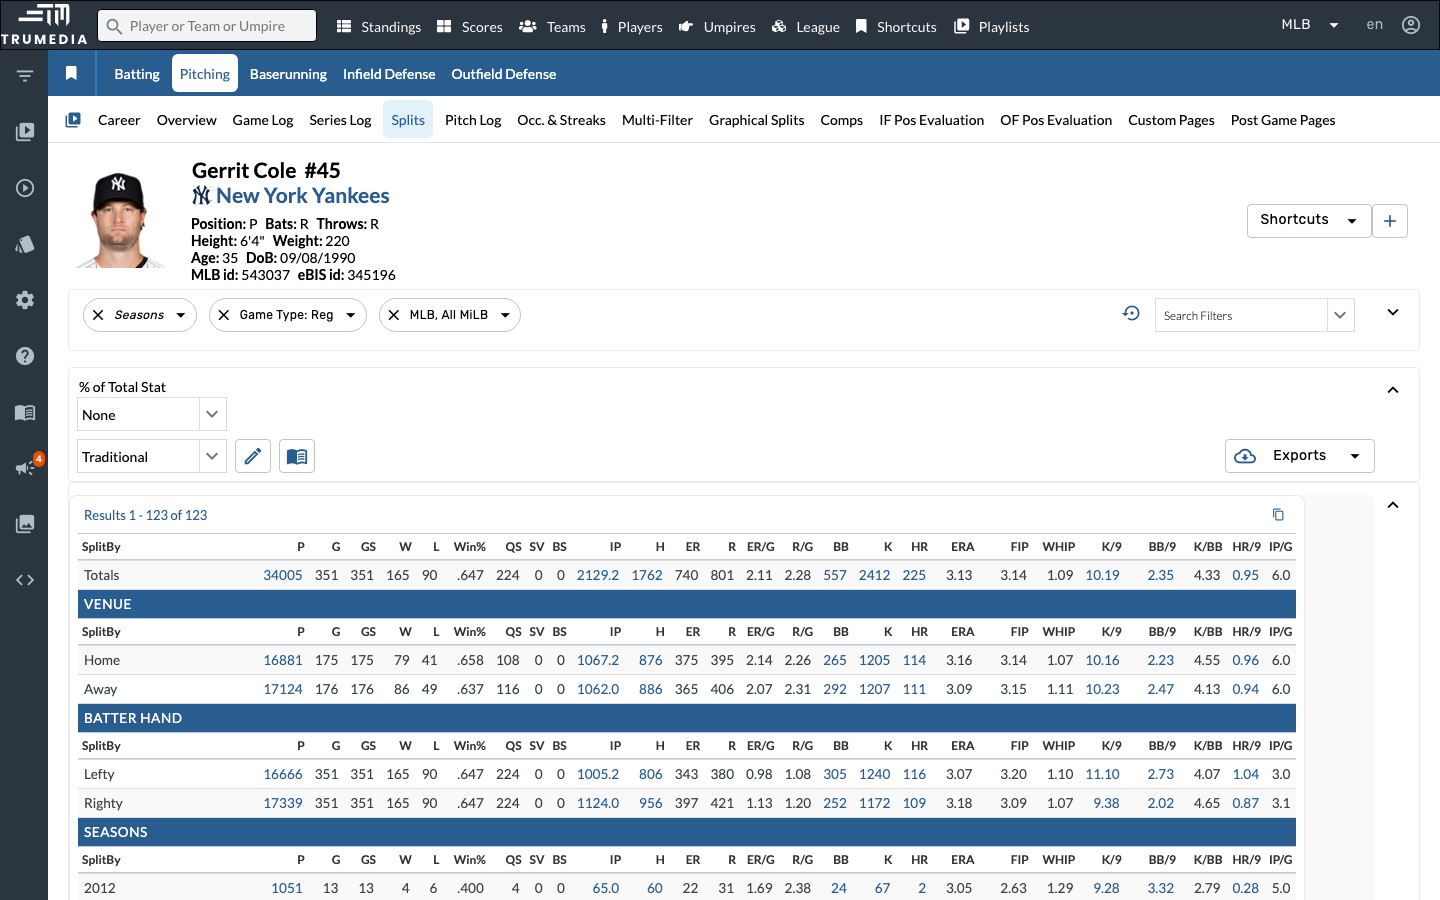
Step 3: Open the Splits tab
Click Splits in the player sub-navigation to open the full splits breakdown. This tab shows the pitcher's stats sliced across every available dimension — venue, batter hand, season, month, inning, pitch type, batted ball type, zone location, count, and more.
The Splits tab loads all split dimensions at once in a single scrollable table. The Pitch Type section is further down — scroll past Venue, Batter Hand, Seasons, Month, Day/Night, and Inning to find it.
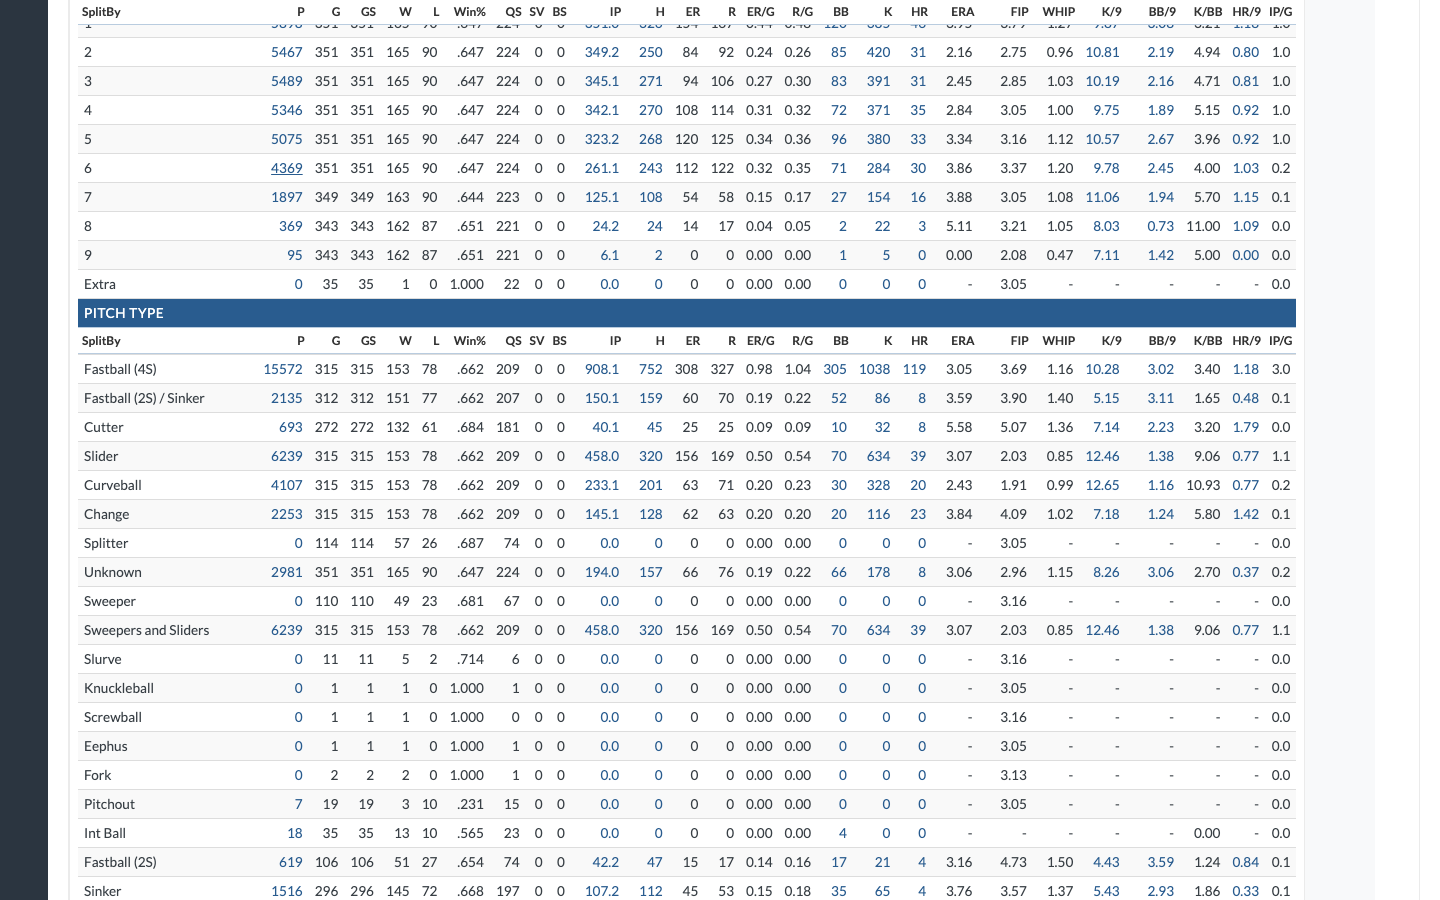
Step 4: Find the Pitch Type breakdown
Scroll down to the Pitch Type section. Each row represents a different pitch in the pitcher's arsenal — Fastball (4S), Cutter, Slider, Curveball, Changeup, Sweeper, and others.
The table shows traditional pitching stats for each pitch type including total pitches, innings pitched, ERA, WHIP, FIP, K/9, BB/9, and batting average against. This lets you directly compare the effectiveness of each pitch.
Look at the P (pitches) column to identify the pitcher's primary pitches by volume, then compare ERA and WHIP across pitch types to see which ones are most and least effective.
Key Takeaway
A pitcher's repertoire is more than just what pitches they throw — it's how each pitch is located, how often it's used, and how effective it is. TruMedia's Overview charts give you a visual snapshot of pitch location and frequency, while the Splits tab lets you compare traditional and advanced stats across every pitch type in the arsenal.
Next Steps
- Try filtering by game situation to see how repertoire usage changes with runners on or in different counts
- Use the custom leaderboard builder to rank pitchers by a specific pitch metric
- Use year-over-year comparison to see how a pitcher's repertoire has evolved