Build a Custom Page or Report
Use TruMedia's Custom Pages builder to assemble a reusable dashboard tailored to your specific workflow. In this example, we'll create a General Report for a single player that combines a player header, a label, and a chart — then see it in action on a real player page.
Difficulty: Intermediate · Estimated time: 10–15 minutes
Prerequisites
- Access to the TruMedia platform with Custom Pages permissions
- Familiarity with basic navigation (player pages, stat tables)
What You'll Learn
- How to create a new custom page report from scratch
- How to choose a layout type and report type
- How to add and arrange components (widgets) on the page grid
- How to preview your page with real player data
- How to save your page and access it from a player's stats page
Step 1: Open the Custom Pages builder
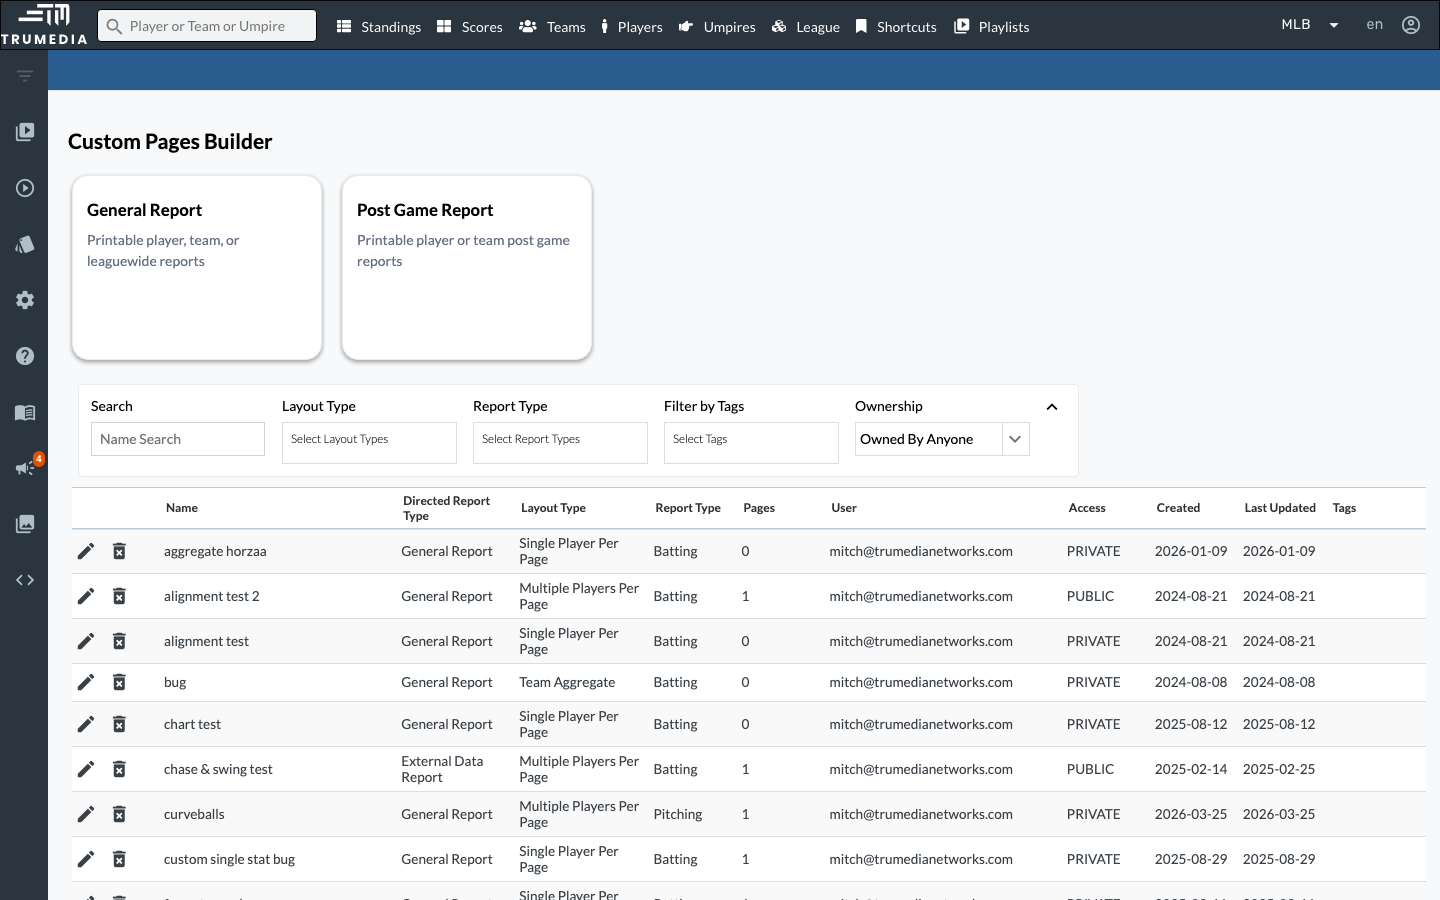
Navigate to the Custom Pages builder by clicking Custom Pages in the left sidebar navigation. You'll land on the builder's home screen, which shows two report type cards at the top — General Report and Post Game Report — and a searchable table of all existing custom pages below.
You can also reach the Custom Pages builder from the Custom Pages tab on any player or team stats page.
Step 2: Select General Report
Click the General Report card. General Reports are the most flexible report type — they support player, team, and league-wide layouts and can be used for scouting reports, game prep, stat summaries, and more.
Post Game Reports are similar but are scoped to a single game's data, making them ideal for automated post-game summaries. External Data Reports (if available) let you pull in data from outside TruMedia.
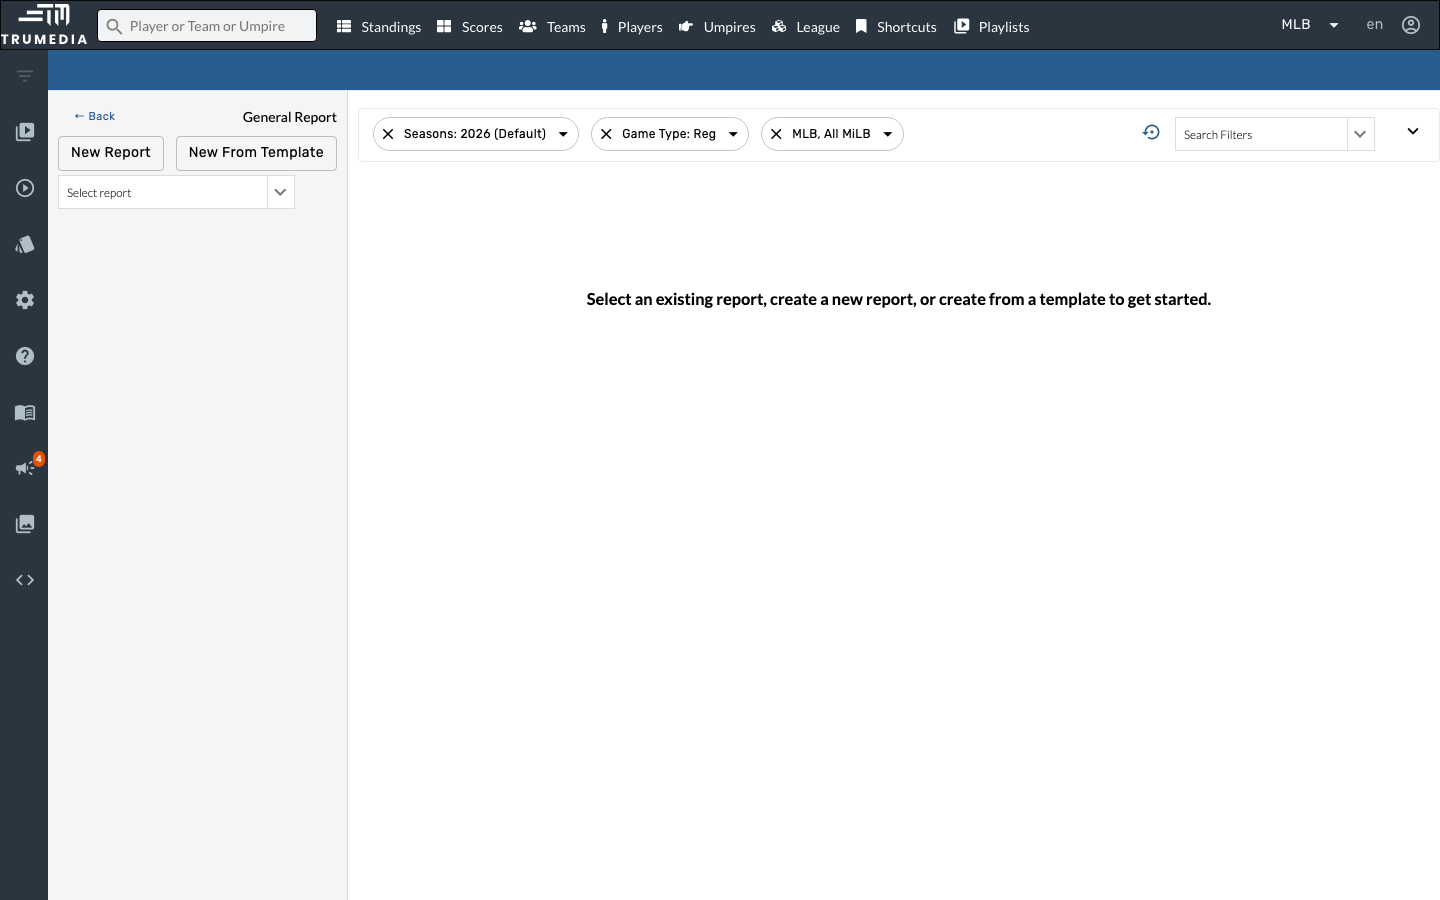
Step 3: Open the New Report modal
Click New Report to open the report creation modal. This is where you'll name your report, choose a layout type, and configure the basic settings.
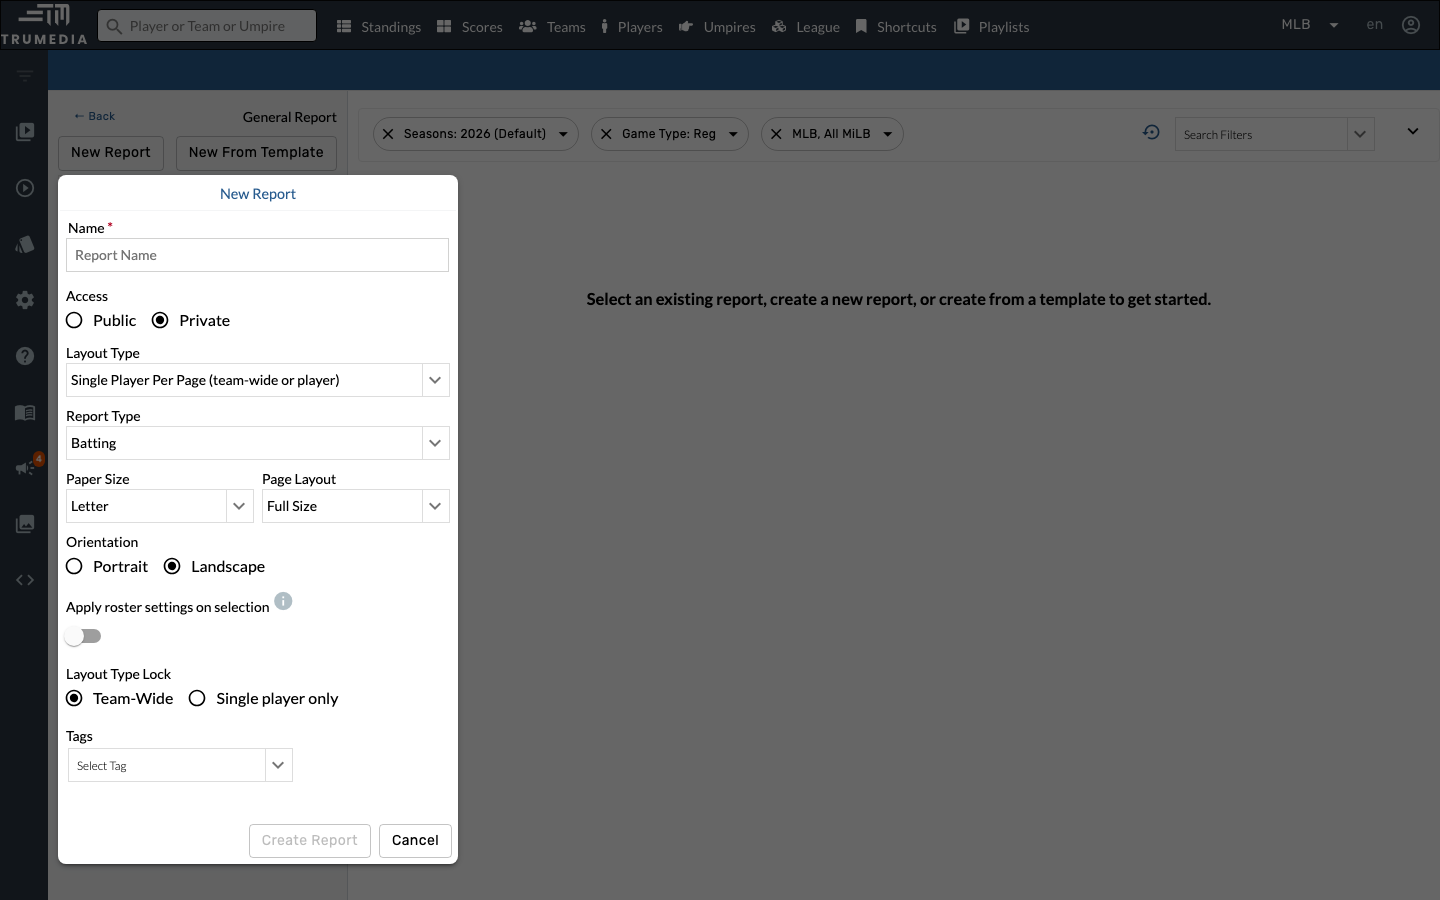
Step 4: Configure and create the report
Fill in the report details in the modal:
- Name: Give your report a descriptive name (e.g., "Player Batting Overview")
- Layout Type: Choose Single Player Per Page — this creates one page per player, ideal for individual scouting reports
- Report Type: Select Batting to work with batting stats and components
- Access: Choose Public to share with all users on your site, or Private to keep it for yourself
- Enter a report name in the Name field
- Verify Layout Type is set to "Single Player Per Page" (the default)
- Verify Report Type is set to "Batting"
- Click Create Report to save and enter the page editor
The Layout Type cannot be changed after the report is created, so choose carefully. Single Player Per Page is the most common choice for player-level dashboards.
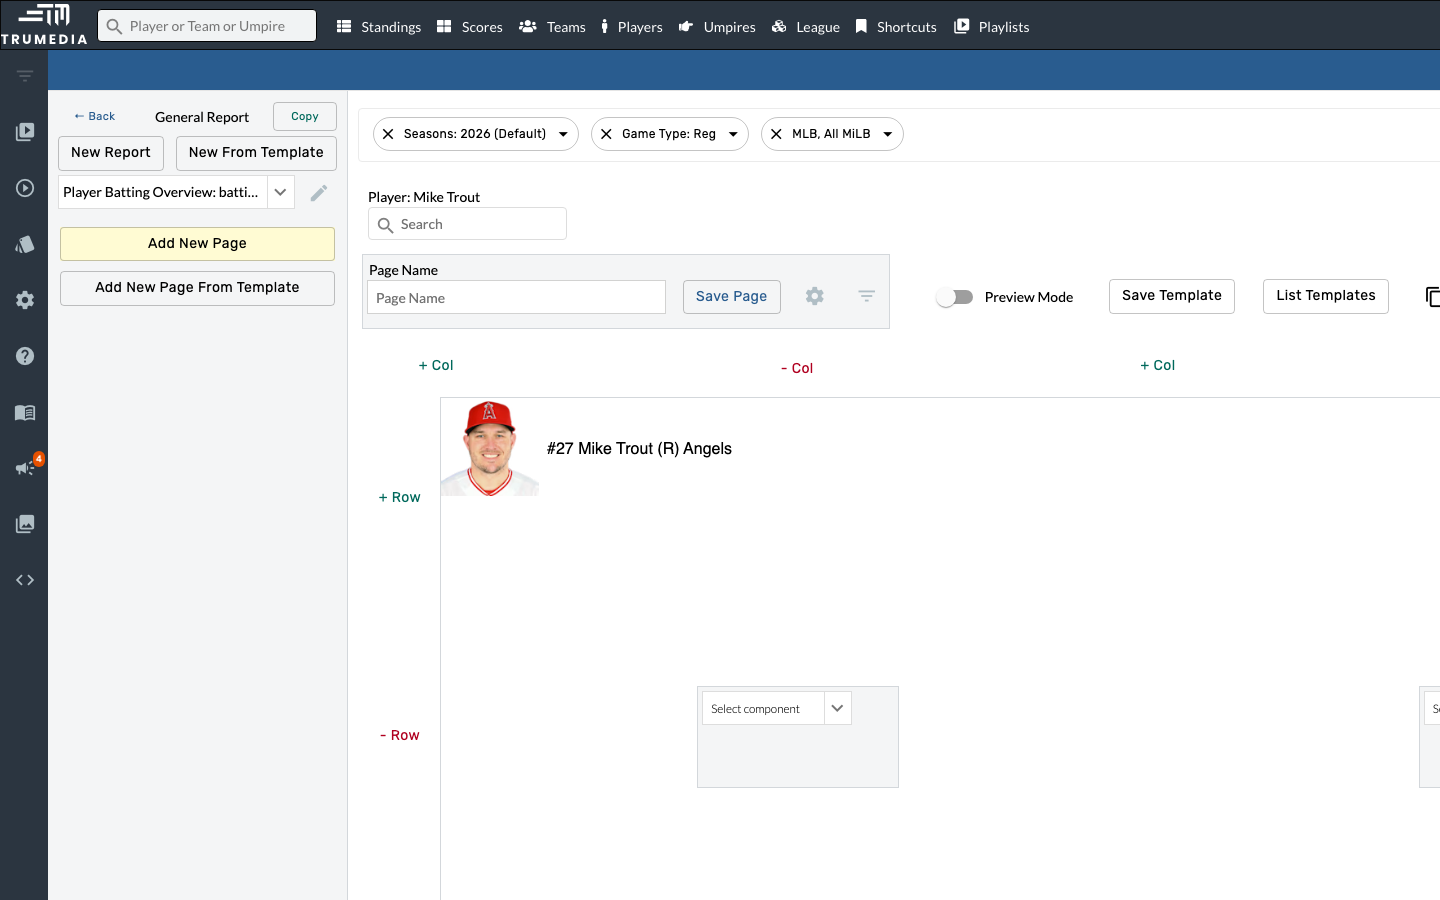
Step 5: Add a new page to the report
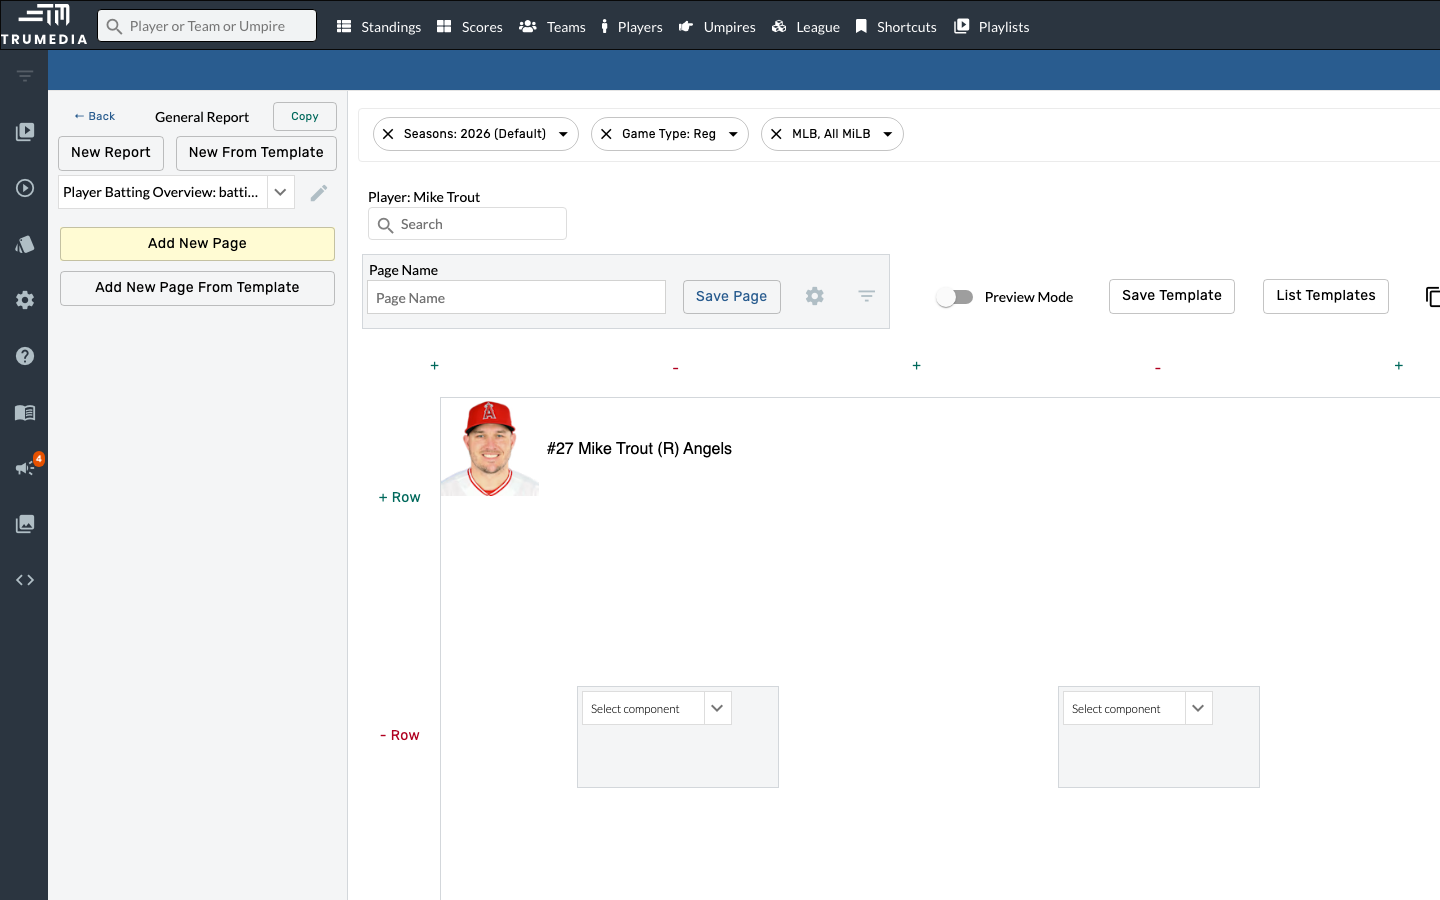
Click Add New Page in the left sidebar panel. This creates a blank page with a grid layout. The page loads with a default player header (showing the currently selected player) and an empty component slot below.
Reports can contain multiple pages. For example, a scouting report might have page 1 for stats tables, page 2 for charts, and page 3 for notes. You can drag pages in the sidebar to reorder them.

Step 6: Add a column to the grid
Click + Col at the top of the canvas to add a second column. This gives us a two-cell row beneath the player header where we can place components side by side — a label on the left and a chart on the right.
You can also add rows with + Row. Components can span multiple rows and columns using the rowspan and colspan settings in each component's configuration, so you don't need a separate cell for every component.
Step 7: Add a Label component
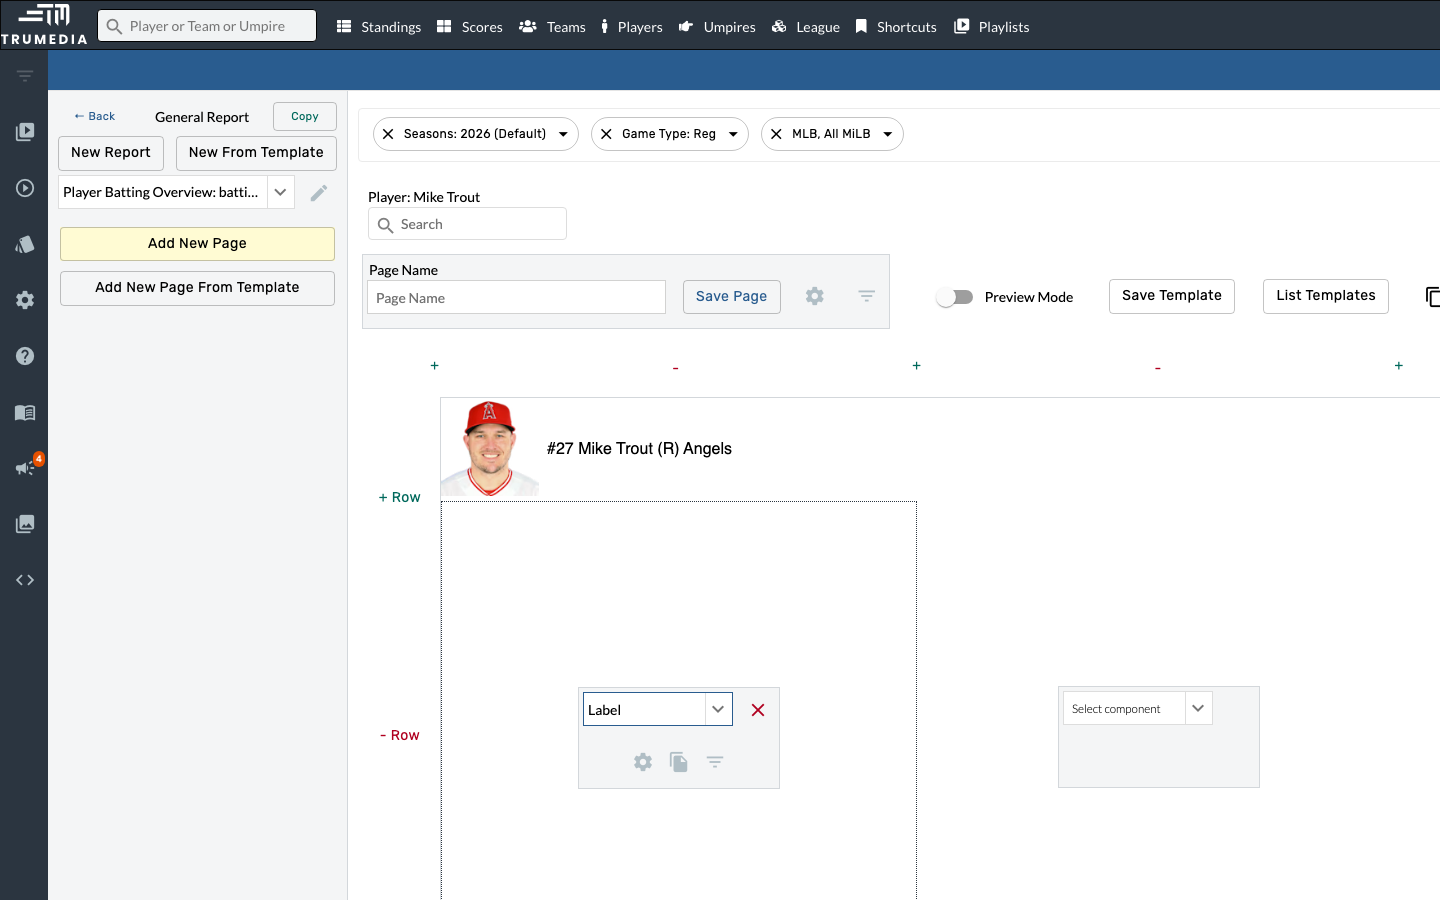
Click the Select component dropdown in the bottom-left cell, then choose Label from the list. Labels let you add custom text to your page — section titles, descriptions, disclaimers, or any context your readers need.
The component dropdown lists all available widget types for your report type. The available components include:
- Label, Player, Note, Image — layout and display components
- Event Histogram, Event Scatter, Time Series, Hit Chart, Heat Map — visualization and chart components
- Standard Table, Splits Table, Ranked Table, Game Log Table — data table components (scroll down in the dropdown to find these)
Step 8: Add an Event Histogram chart
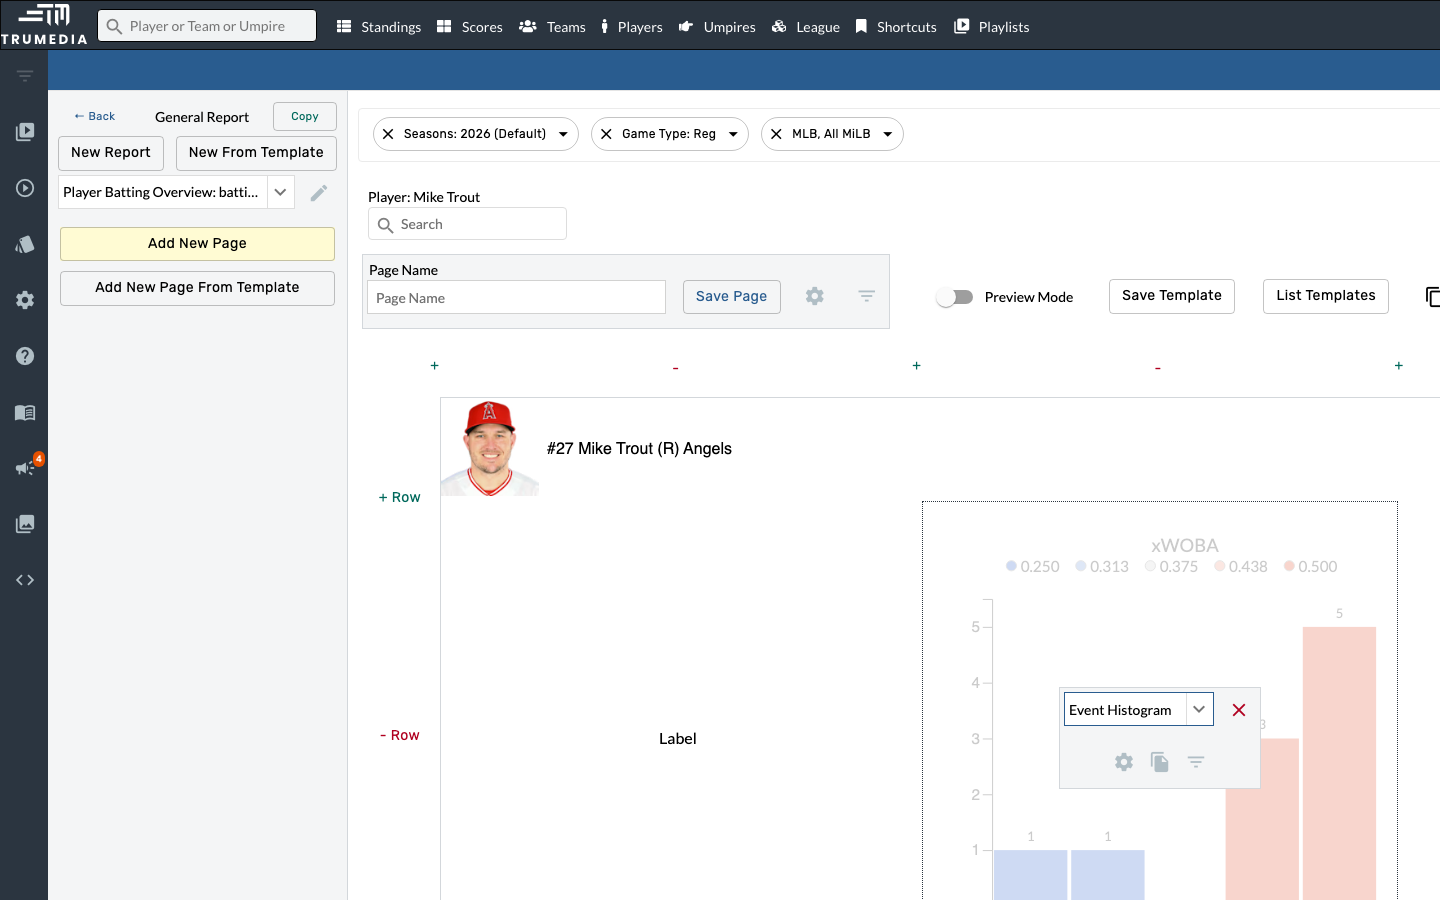
Click the Select component dropdown in the bottom-right cell and choose Event Histogram. This chart visualizes the distribution of batting events (hits, outs, walks, etc.) and is a great complement to a stats table for at-a-glance performance visualization.
TruMedia offers many chart types for custom pages: Hit Charts for batted-ball spray, Heat Maps for strike zone analysis, Time Series for trends over time, Pie Charts for composition breakdowns, and more. Experiment to find the best visualization for your workflow.
Step 9: Save the page
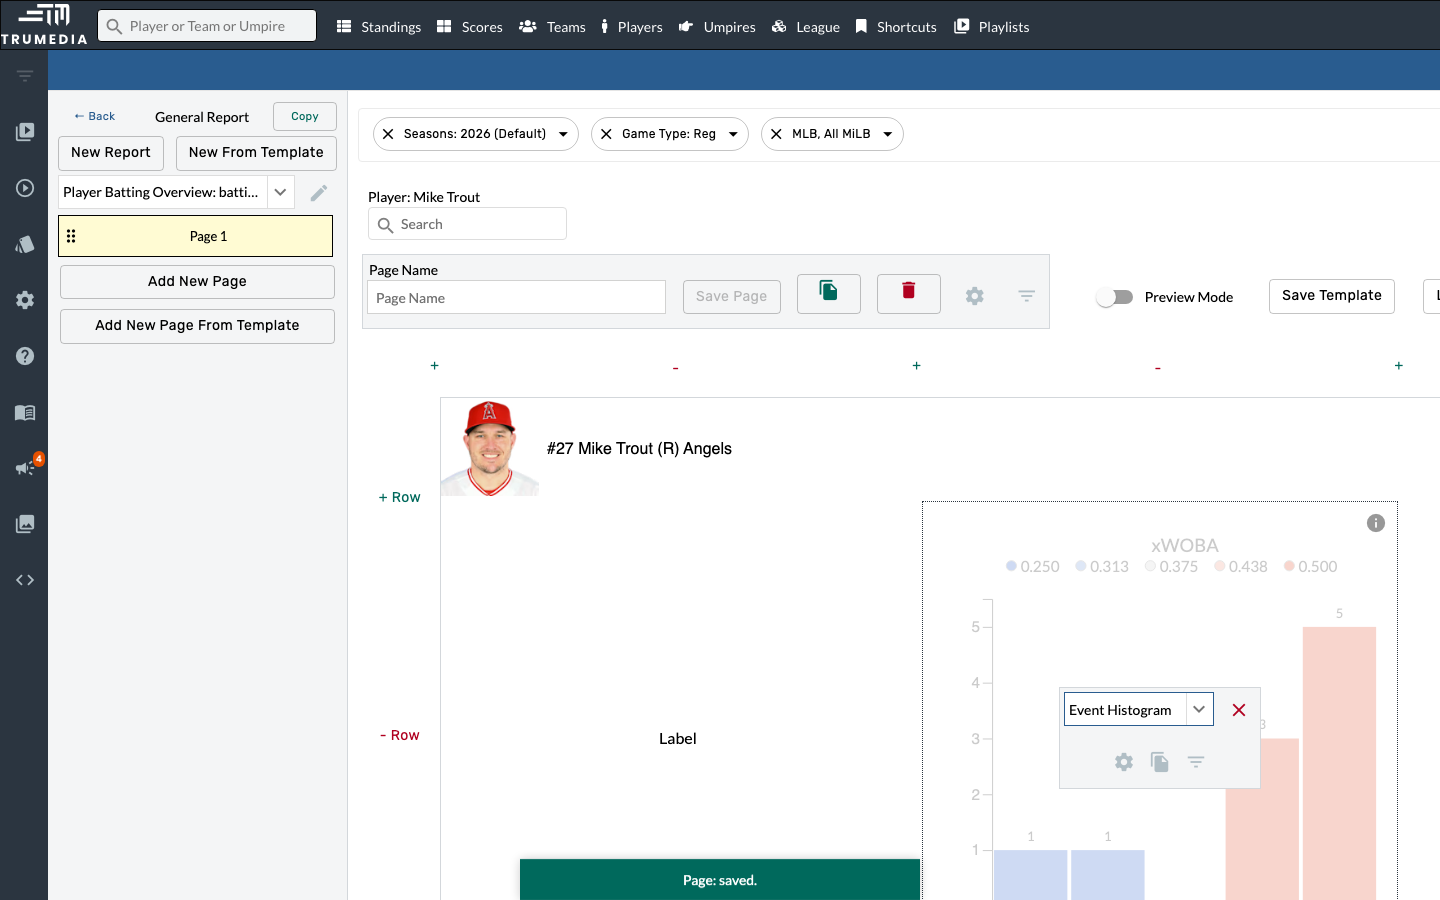
Click Save Page to persist your layout. You can optionally give the page a name in the Page Name field before saving — this helps identify pages in multi-page reports.
Get in the habit of saving frequently as you build. If you navigate away without saving, you'll lose unsaved changes to the current page.
Step 10: Navigate to a player's stats page
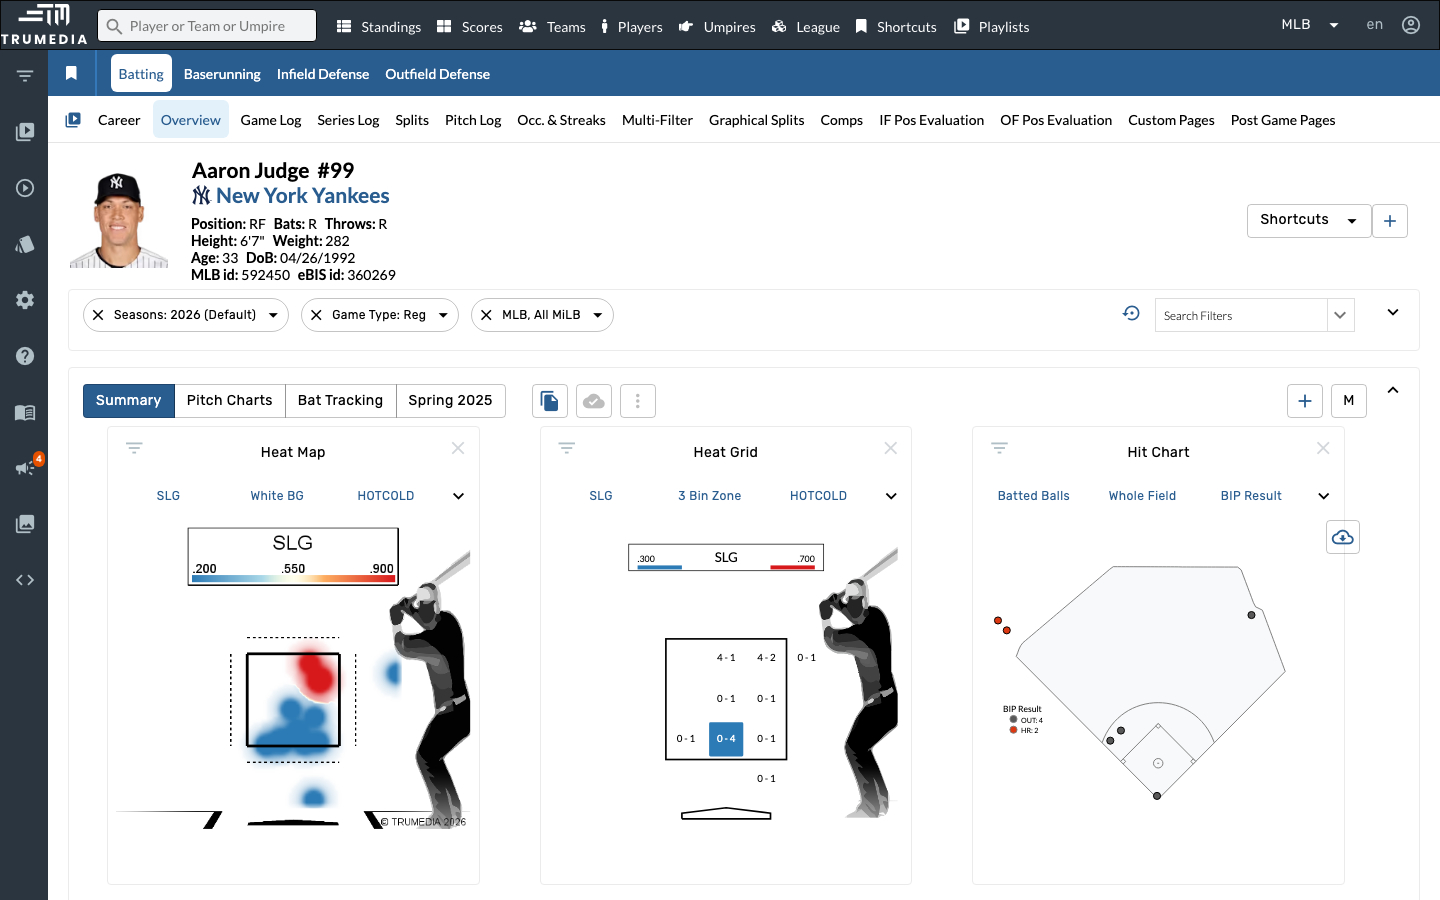
Now that the custom page is saved, let's see it in action. Navigate to a player's batting stats page — in this example, we'll go to Aaron Judge's page.
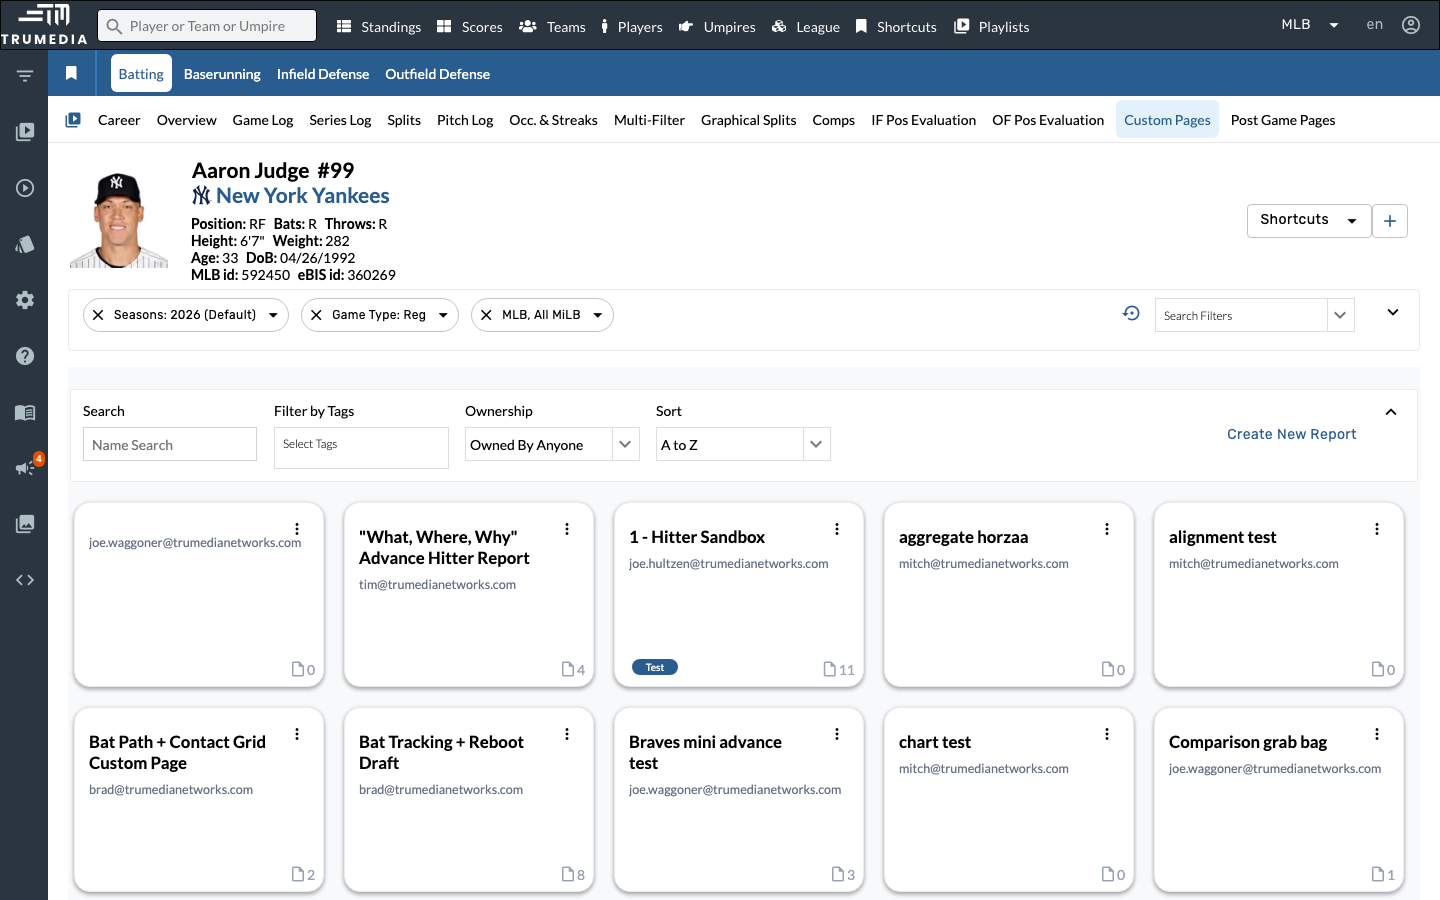
Step 11: Open the Custom Pages tab
Click the Custom Pages tab in the player's sub-navigation bar. This tab lists all custom page reports available for this player — both your own private reports and any public reports shared across your site. Reports are displayed as cards with thumbnails, and you can search, filter by tags, or sort them.
The Custom Pages tab is available on player pages, team pages, and other entity pages. The reports shown depend on the layout type — a "Single Player Per Page" report appears on player pages, while a "Team Aggregate" report appears on team pages.
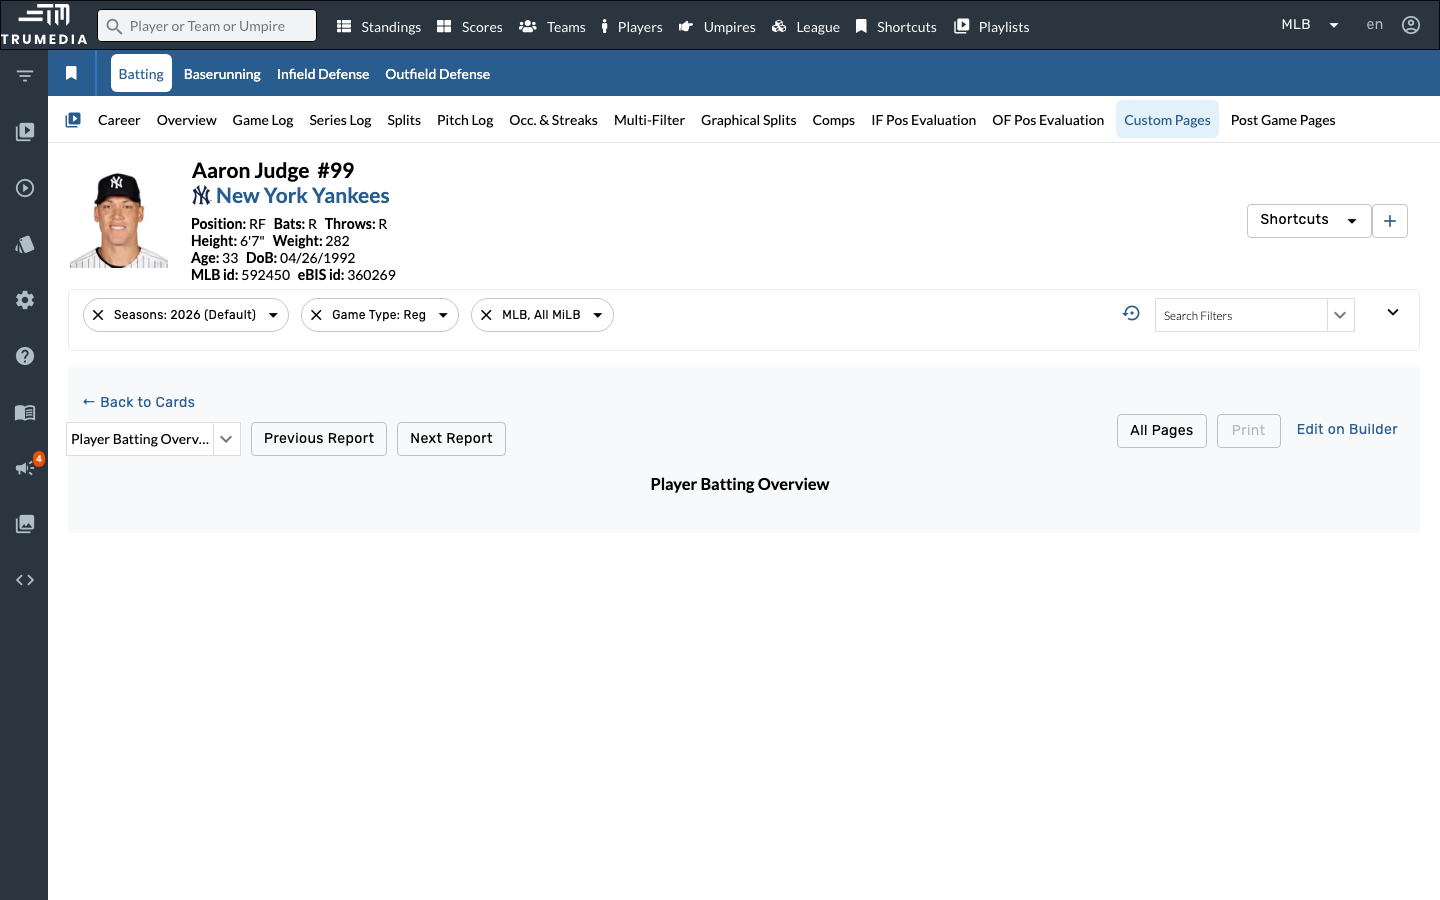
Step 12: Open your custom page report
Find and click the Player Batting Overview report card. The page renders your custom layout — the player header, label, and Event Histogram chart — populated with Aaron Judge's real batting data.
This is the reusable dashboard you built. Every time you visit a player's Custom Pages tab and select this report, you'll see the same layout populated with that player's data — no need to rebuild it each time.
If you don't see your report right away, use the Search field or change the Ownership filter to "Owned By Me" to narrow the list.
Key Takeaway
Custom pages let you build reusable dashboards that combine exactly the stats, charts, and layouts you need. Once saved, they're accessible from the Custom Pages tab on player and team pages, and public pages are visible to all users on your site. Start simple with a label and a chart, then layer in stats tables, additional pages, and templates as your workflow demands.
Next Steps
- Try adding conditional formatting to highlight key values in your custom page tables
- Use custom stats to add proprietary metrics to your report
- Build a custom leaderboard to rank players by the stats in your report