Evaluate a Hitter's Approach by Count
See how a hitter's chase rate, whiff rate, batting average, and other metrics change across different ball-strike counts. In this example, we'll look at Aaron Judge's splits by count to understand how his approach shifts as the count evolves.
Difficulty: Beginner · Estimated time: 2–3 minutes
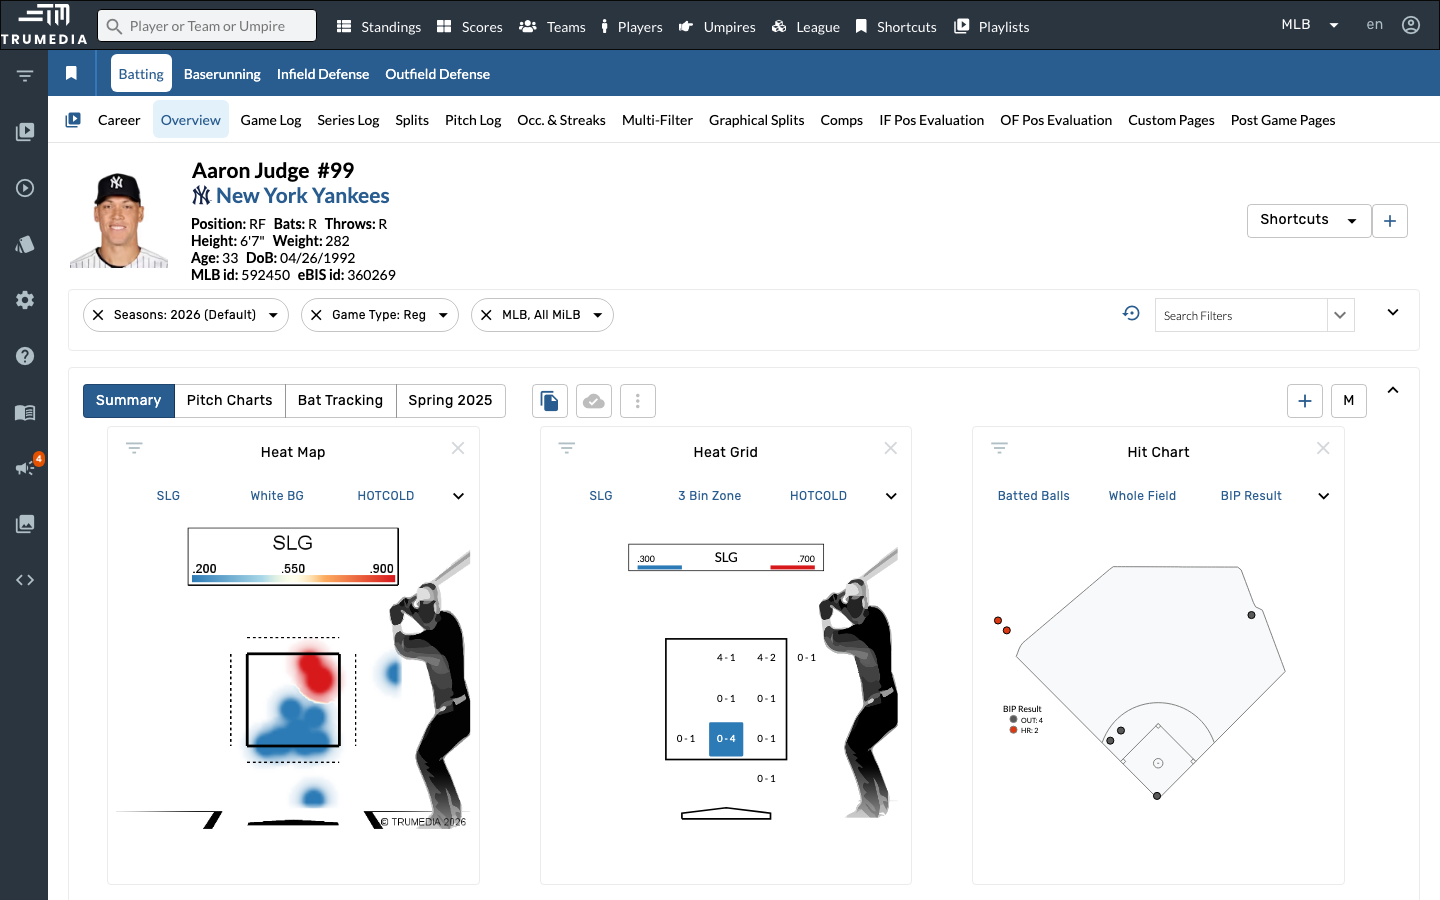
Step 1: Navigate to a hitter's stats page
Go to a player's batting stats page. In this example, we'll analyze Aaron Judge's approach by count.
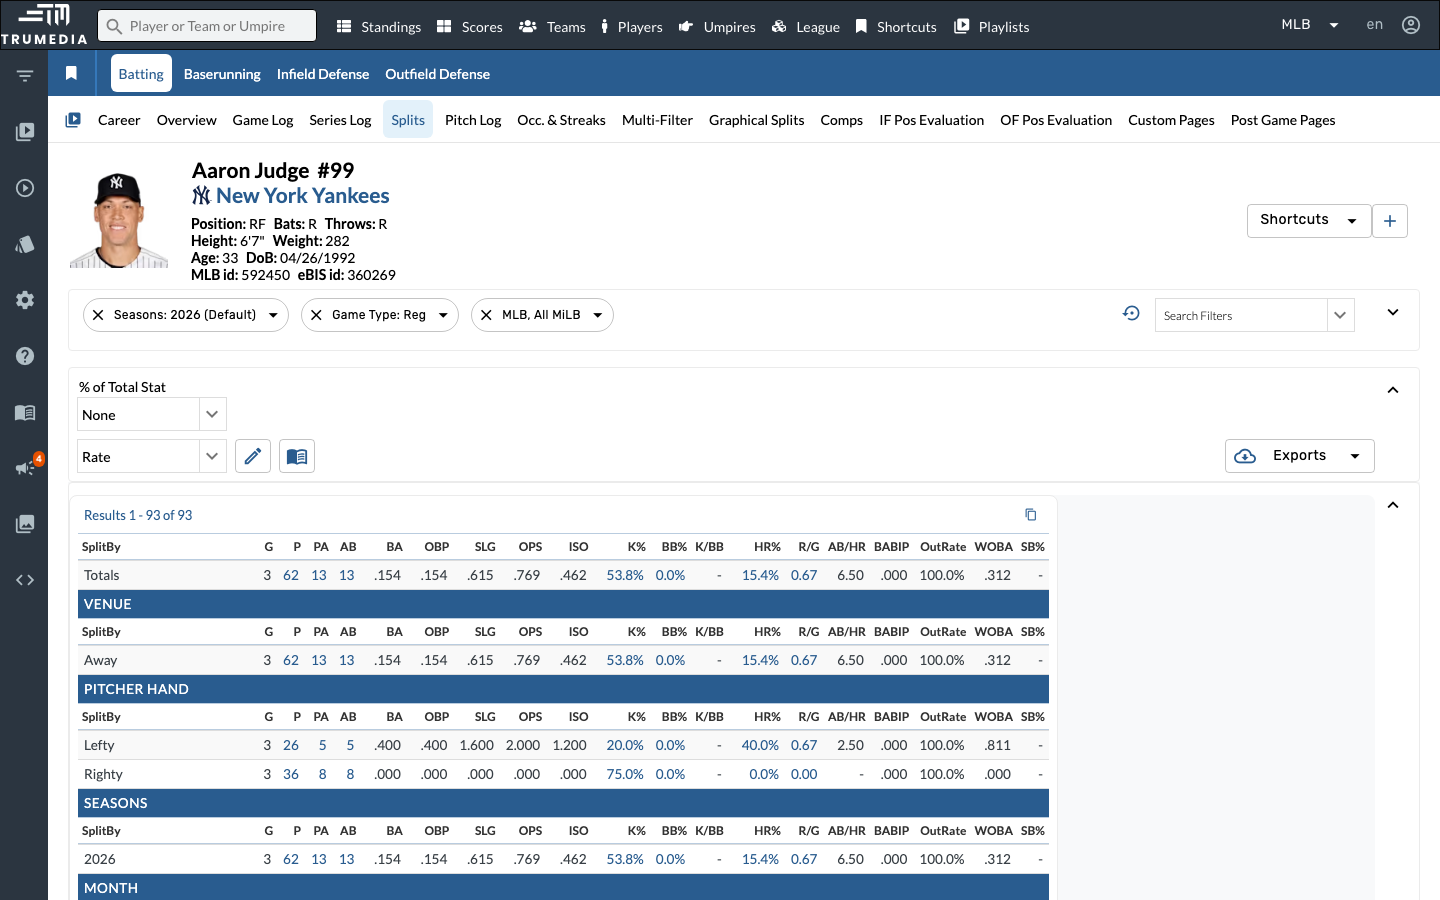
Step 2: Open the Splits tab
Click Splits in the player sub-navigation. The Splits view breaks down a player's stats across every available dimension — platoon, venue, month, pitch type, count, and more — all on a single scrolling page.
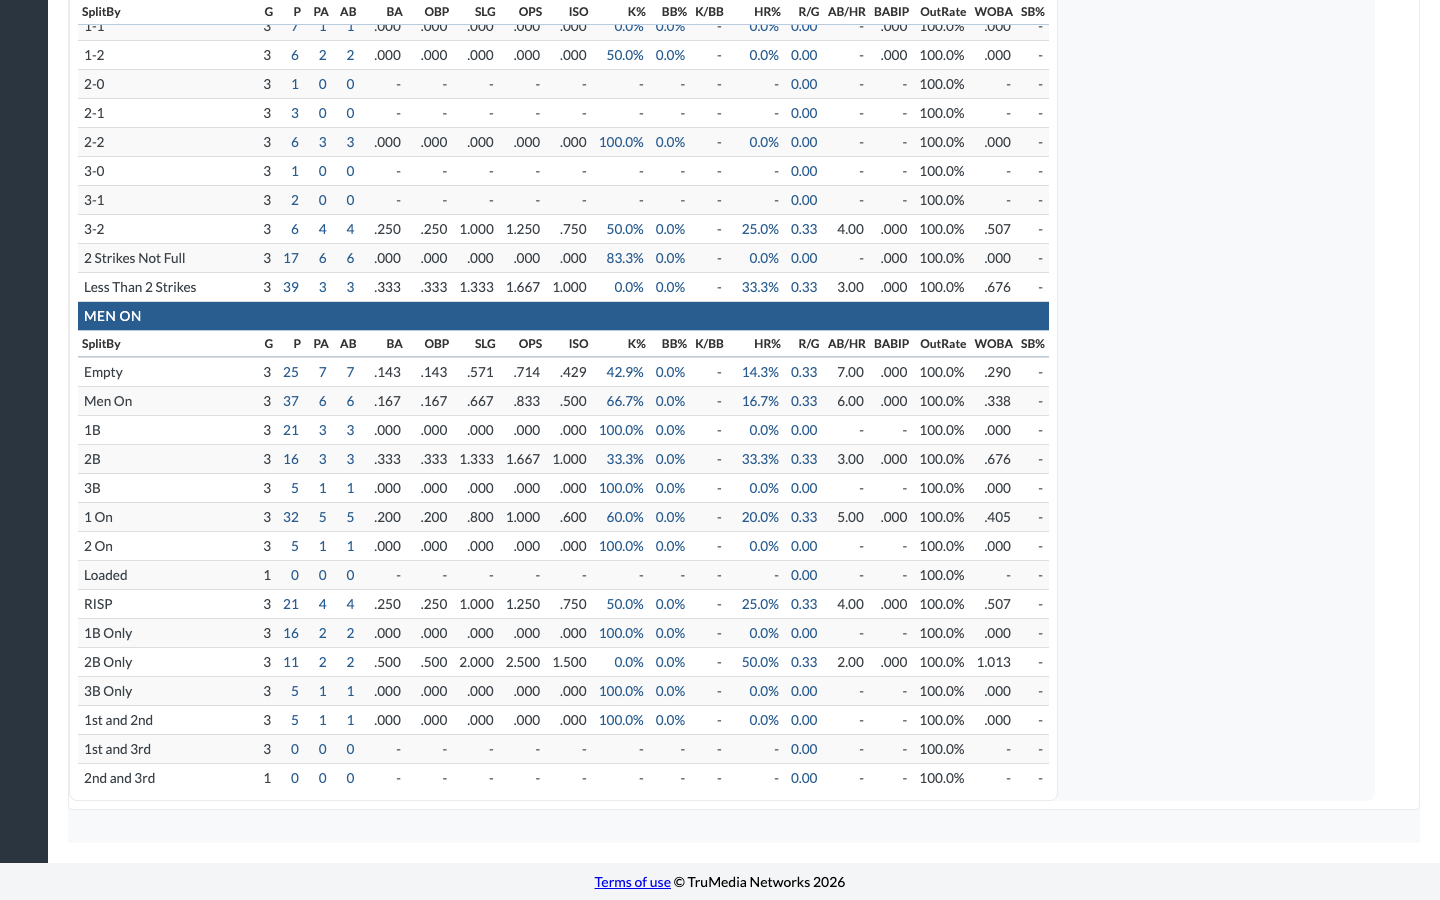
Step 3: Scroll to the Count section
Scroll down past the Pitch Type and Batted Ball sections to find the Count split. This table shows the player's stats broken out by every ball-strike count — from 0-0 through 3-2 — plus aggregate groupings like 2 Strikes Not Full and Less Than 2 Strikes.
Compare key columns across rows to see how the hitter's approach changes as the count develops. For example, look at K% and BB% to see how selectivity shifts, or SLG and ISO to see when the hitter does the most damage.
The 3-2 and 0-0 rows are especially revealing. A hitter with a high SLG on 0-0 is likely an aggressive first-pitch hitter. A high K% on 3-2 compared to 2-0 tells you how much their approach changes when behind.
Key Takeaway
Splitting a hitter's stats by count reveals how their approach changes as the at-bat develops. Most hitters are more selective early and more aggressive when behind — but the degree of that shift varies widely. Understanding count-by-count tendencies helps pitchers exploit patterns and helps hitters identify where they're most vulnerable.