Team Batting Leaderboard by Vertical Pitch Location
Filter the NCAA team batting leaderboard by vertical pitch location to see how teams handle pitches in the upper third vs. the lower third of the strike zone. In this example, we'll narrow to ACC-only matchups and compare batting average by zone.
Difficulty: Intermediate · Estimated time: 3–5 minutes
What You'll Learn
- How to use vs Conference and Current Team Conference filters together to isolate conference matchups
- How to use the Vertical Location filter to split by strike zone region
- How to compare upper-third vs. lower-third batting performance across teams
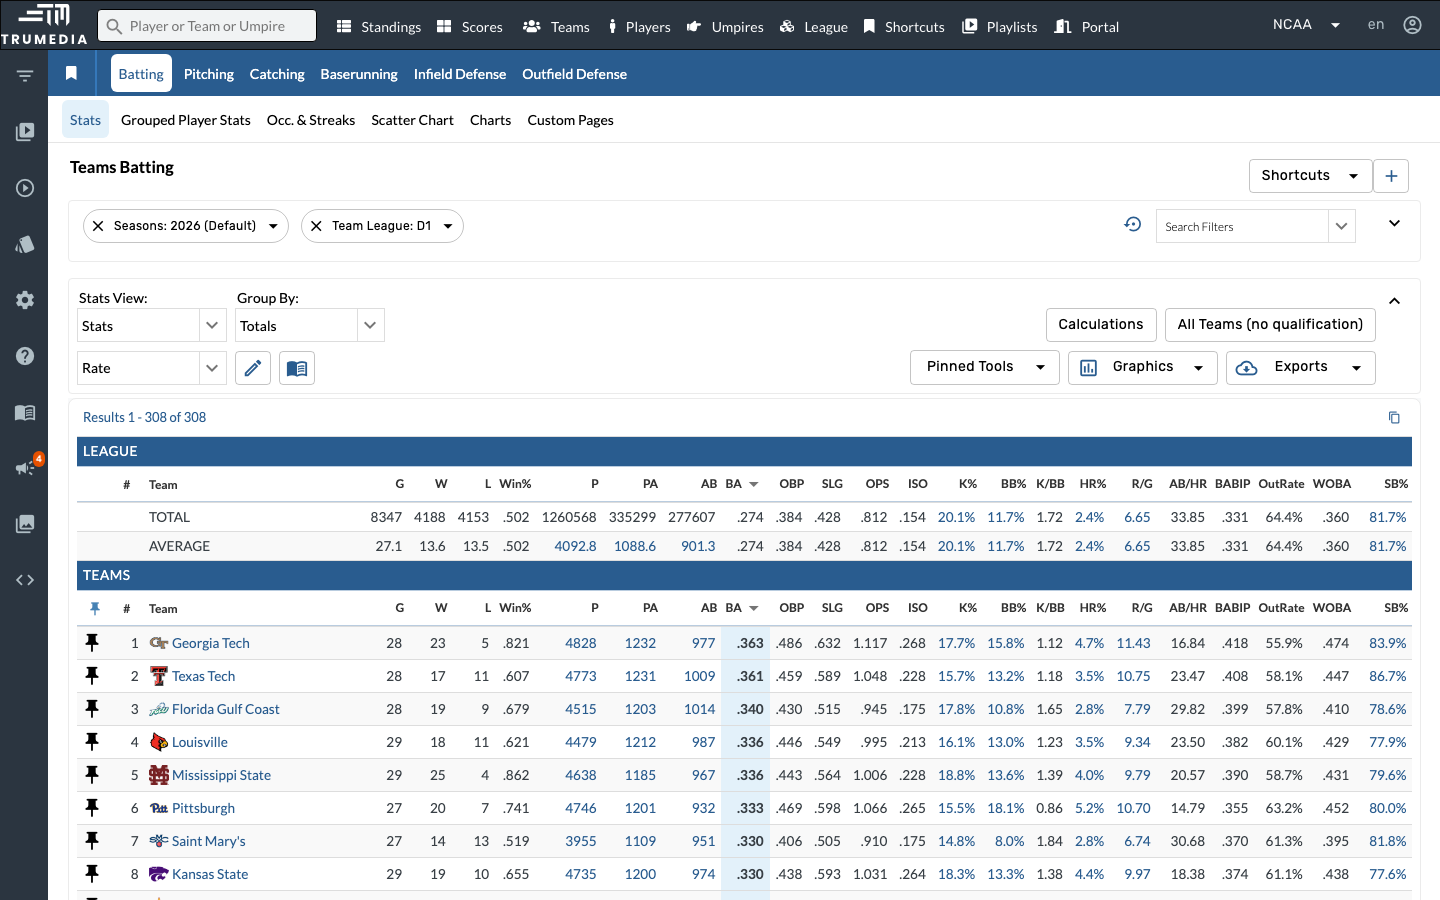
Step 1: Navigate to the Teams Batting stats page
Click Teams in the top navigation, then select the Batting tab. The default view shows all D1 teams for the current season.
Step 2: Open the Search Filters panel
Click Search Filters to open the filter panel. We'll add three filters: Vertical Location, vs Conference, and Current Team Conference.
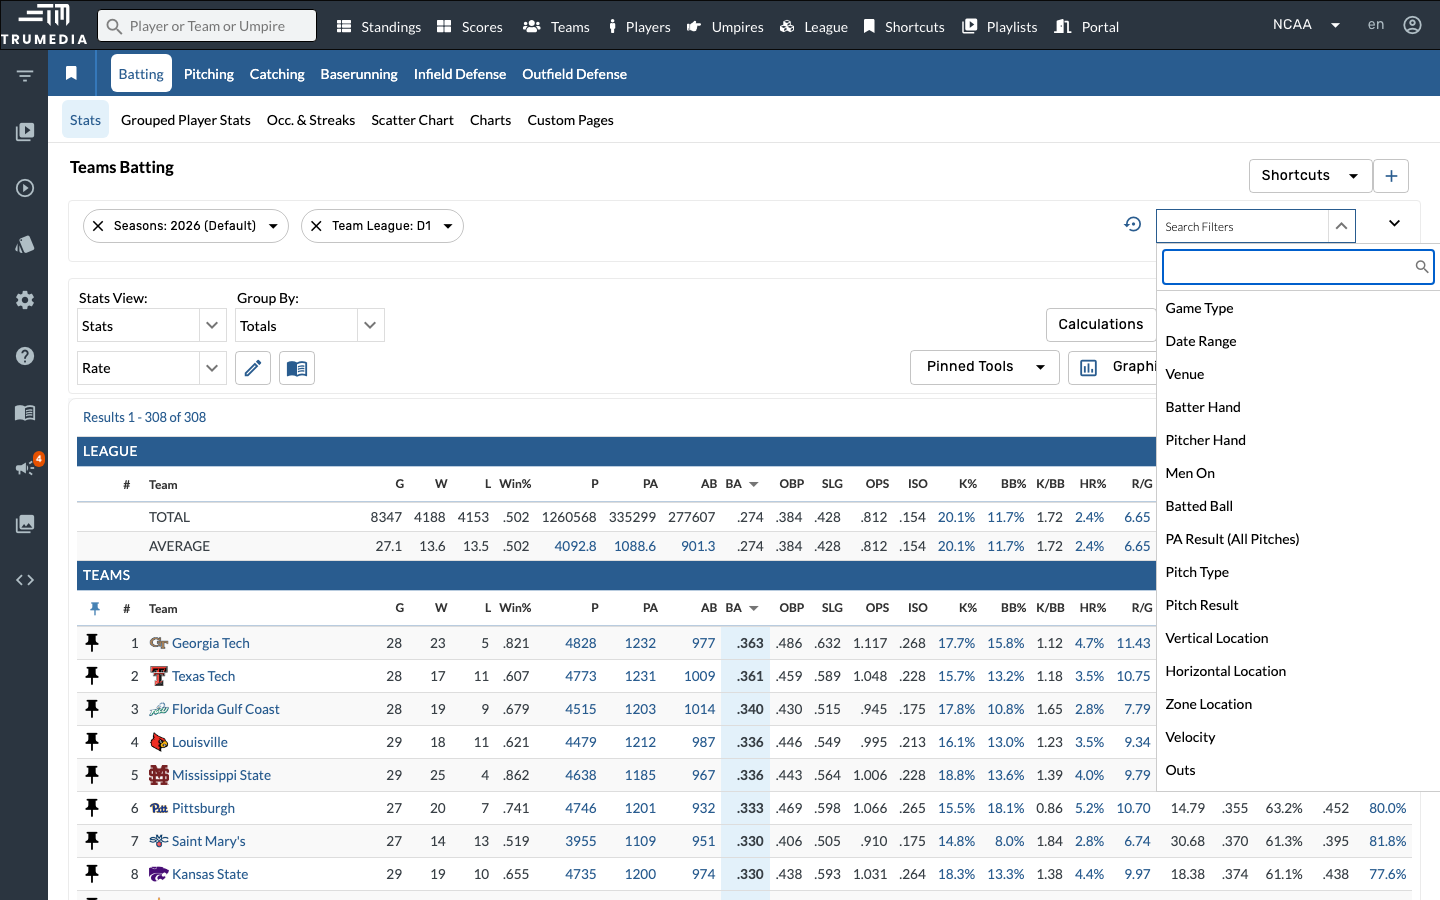
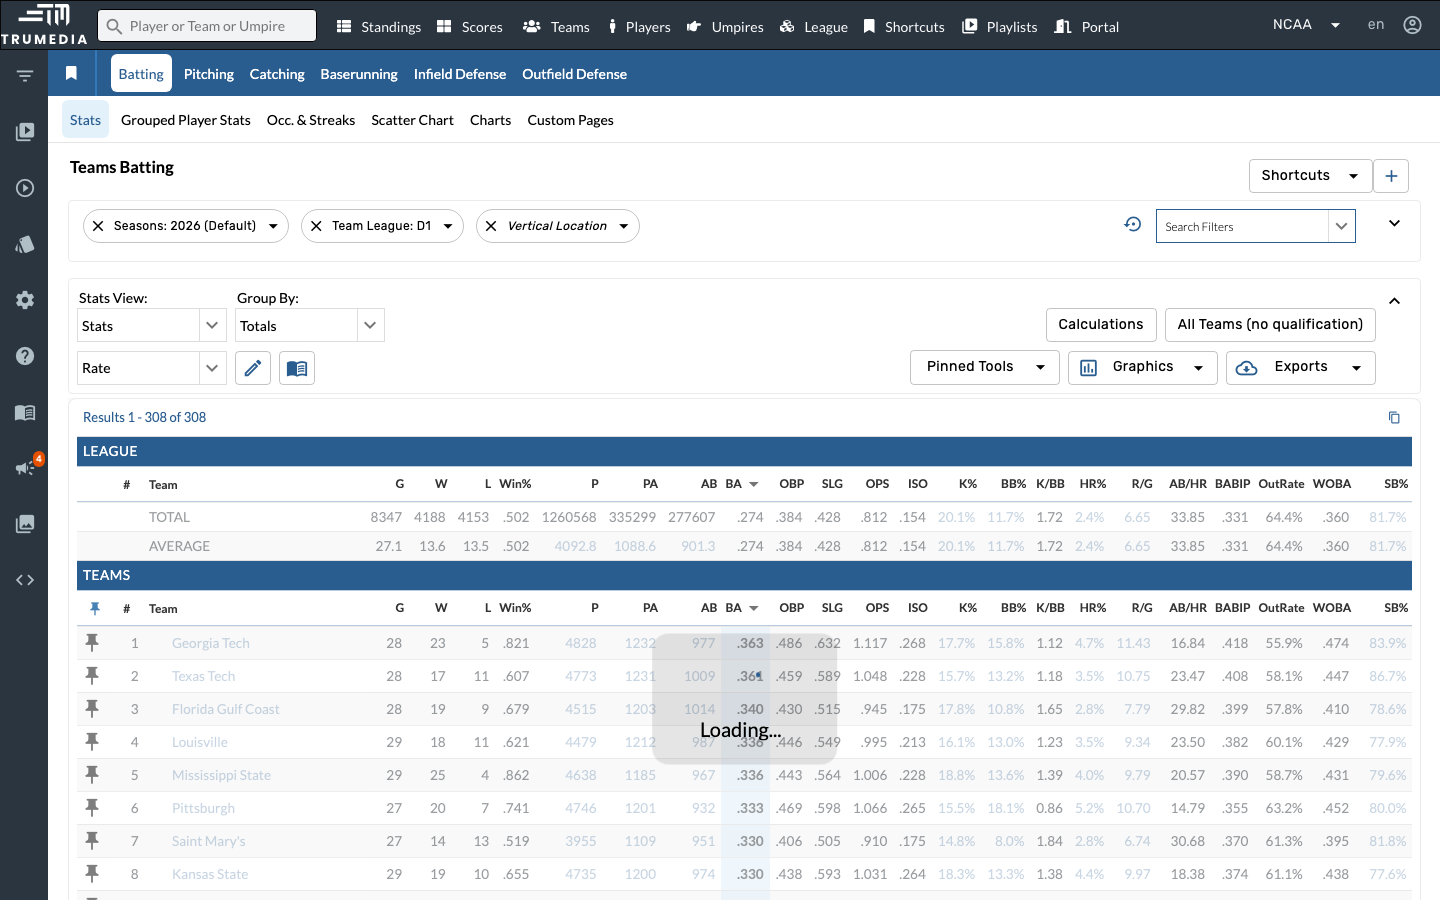
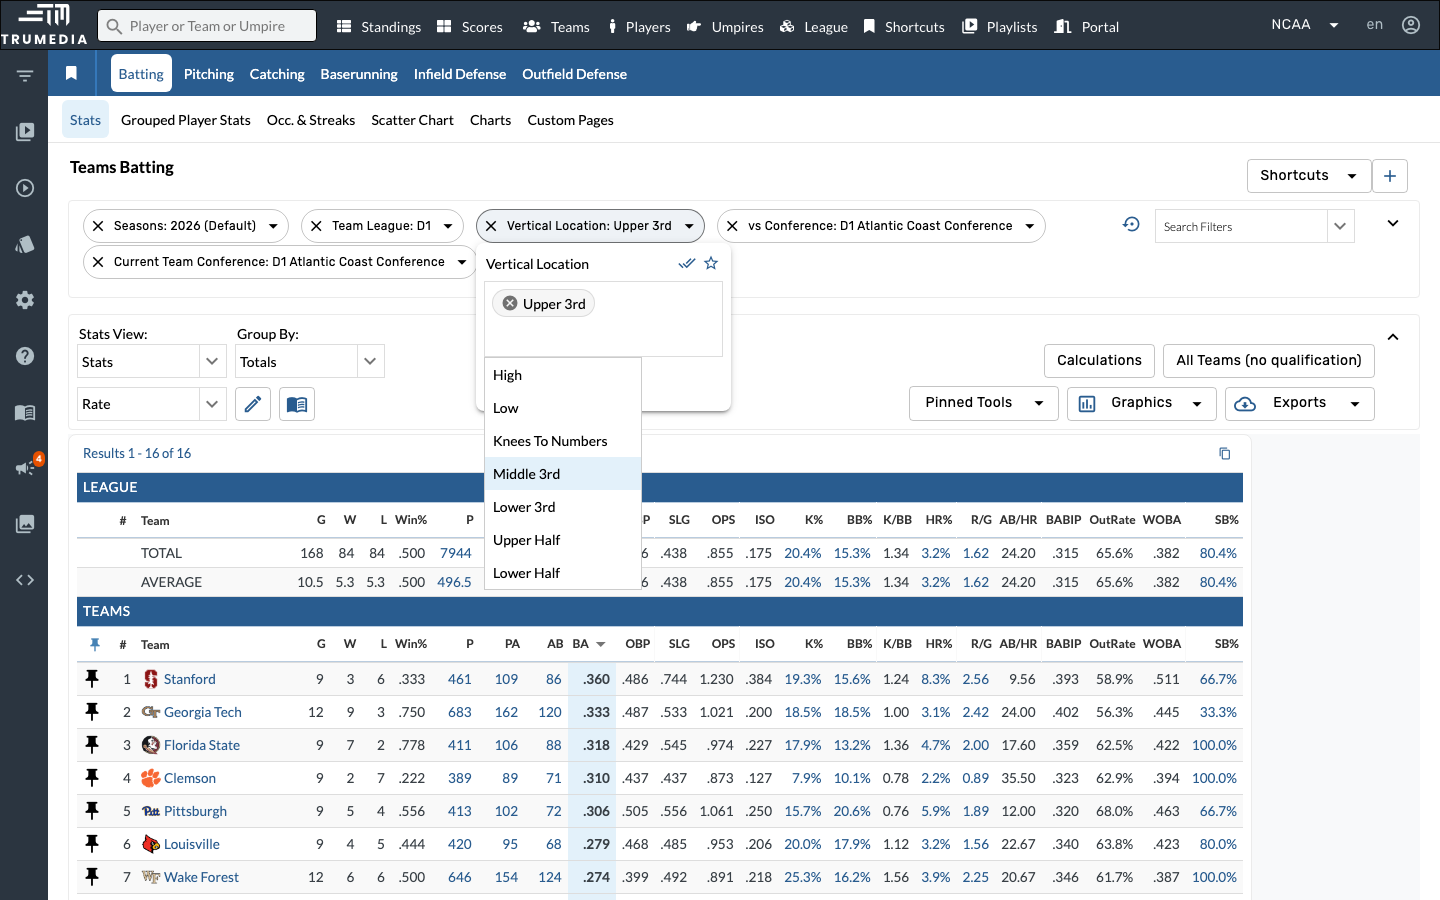
Step 3: Add the Vertical Location filter
Click Vertical Location in the filter list. This lets you isolate pitches by their vertical position in the strike zone — Upper 3rd, Middle 3rd, Lower 3rd, and more.
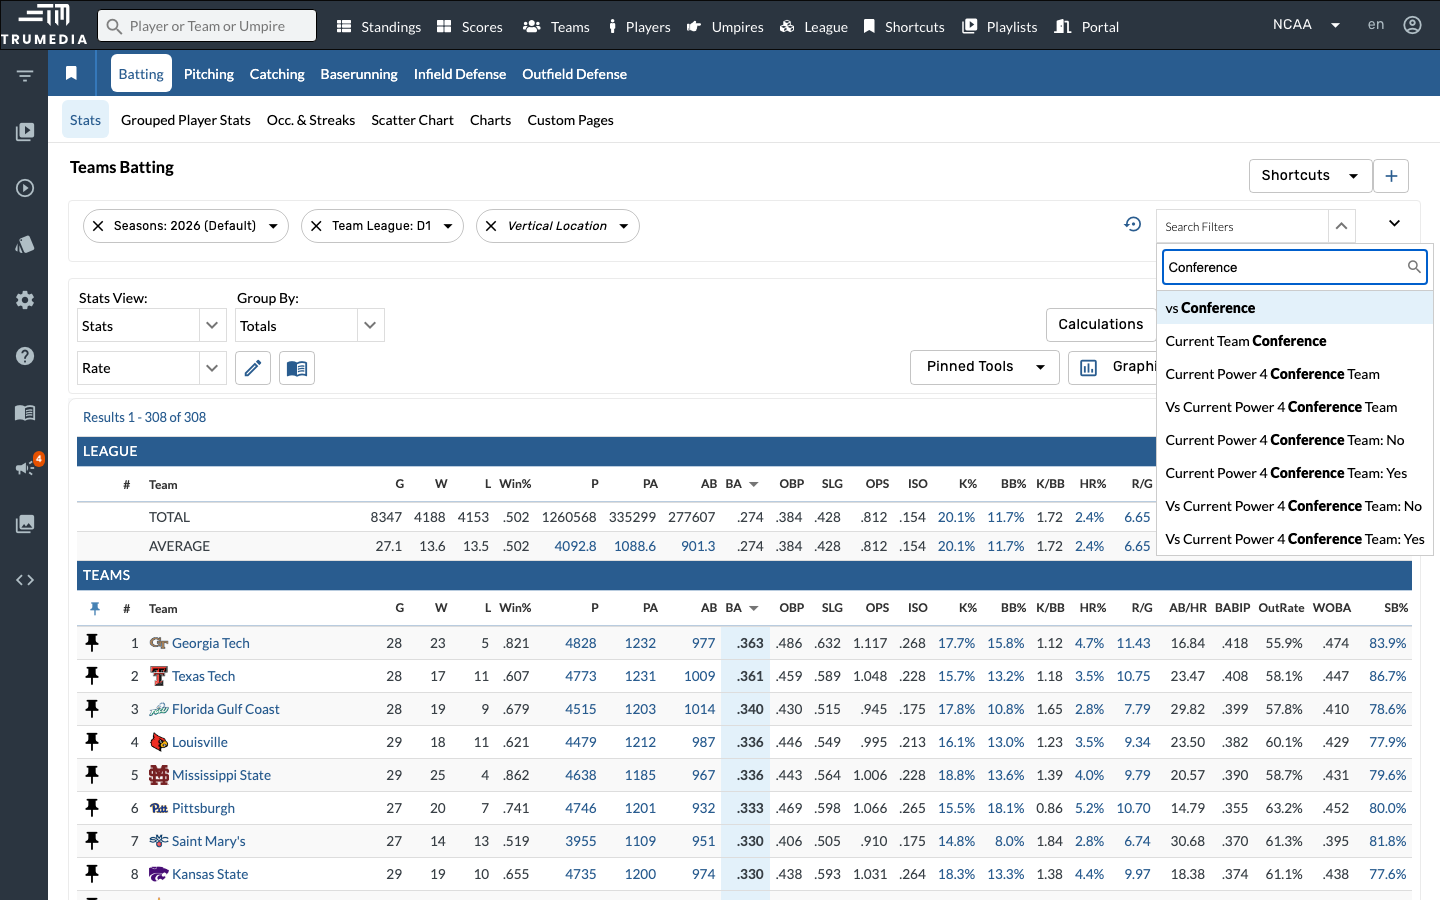
Step 4: Add the Conference filters
Search for Conference and add both vs Conference and Current Team Conference. Using both together ensures you see only ACC teams playing against other ACC teams — true conference matchups.
vs Conference filters the opponents; Current Team Conference filters the teams themselves. Applying both to the same conference shows only intra-conference games.
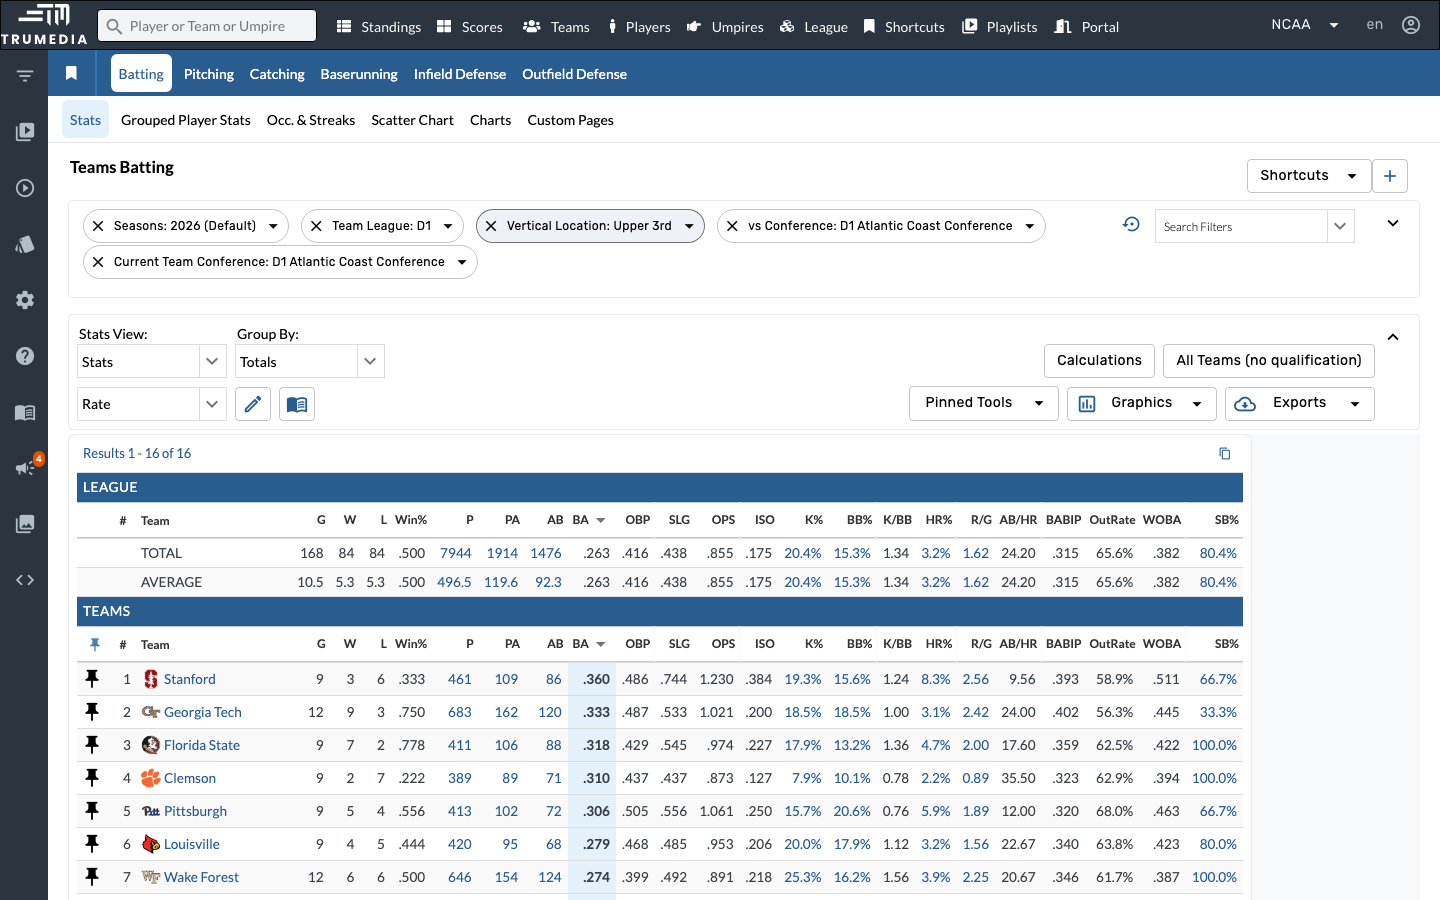
Step 5: Filter to ACC matchups, Upper 3rd
Set vs Conference and Current Team Conference both to D1 Atlantic Coast Conference, and Vertical Location to Upper 3rd. The leaderboard reloads to show only ACC teams with batting stats on upper-third pitches in conference games.
Step 6: Sort by batting average — Upper 3rd
Sort by BA to rank ACC teams by how well they hit pitches in the upper third of the strike zone.
Step 7: Switch to Lower 3rd
Change the Vertical Location filter from Upper 3rd to Lower 3rd and sort by BA. Compare the rankings — teams that dominate high pitches may struggle low in the zone, and vice versa.
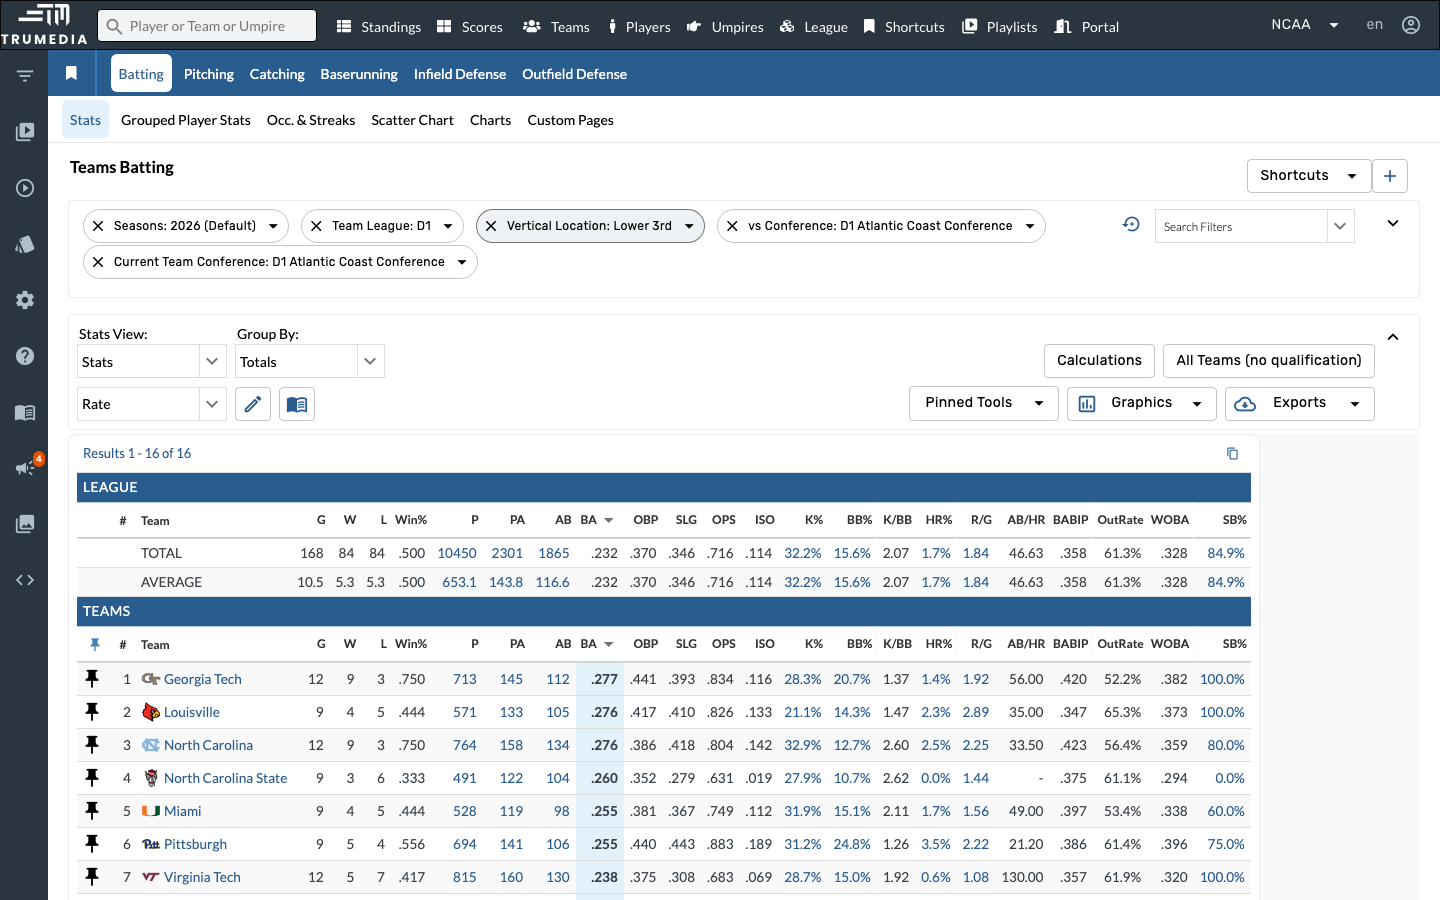
Key Takeaway
Vertical pitch location has a dramatic impact on batting performance, and the gap between upper-third and lower-third production varies widely from team to team. Identifying which teams crush high pitches but struggle down in the zone (or vice versa) is a valuable scouting edge for pitching staff game-planning.