Pitching Staff XBH Allowed by Zone Location
Identify which pitchers on a team's staff give up the most extra-base hits by filtering for specific pitch characteristics. In this example, we'll use the University of Texas pitching roster to find pitchers vulnerable to high-ride fastballs (using the Induced Vertical Break filter) and pitchers who get hurt on outer-half pitches (using the Horizontal Location filter).
Difficulty: Intermediate · Estimated time: 3–5 minutes
What You'll Learn
- How to switch to the Counting report to see raw counting stats like XBH
- How to use the Induced Vertical Break filter to isolate high-ride fastballs
- How to use the Horizontal Location filter to analyze pitches by zone
- How to sort by XBH to identify the most vulnerable pitchers on a staff
Step 1: Navigate to the University of Texas pitching roster
Go to the University of Texas team page, select the Pitching tab, then click Roster. This view shows every pitcher on the staff with their aggregate stats for the season.
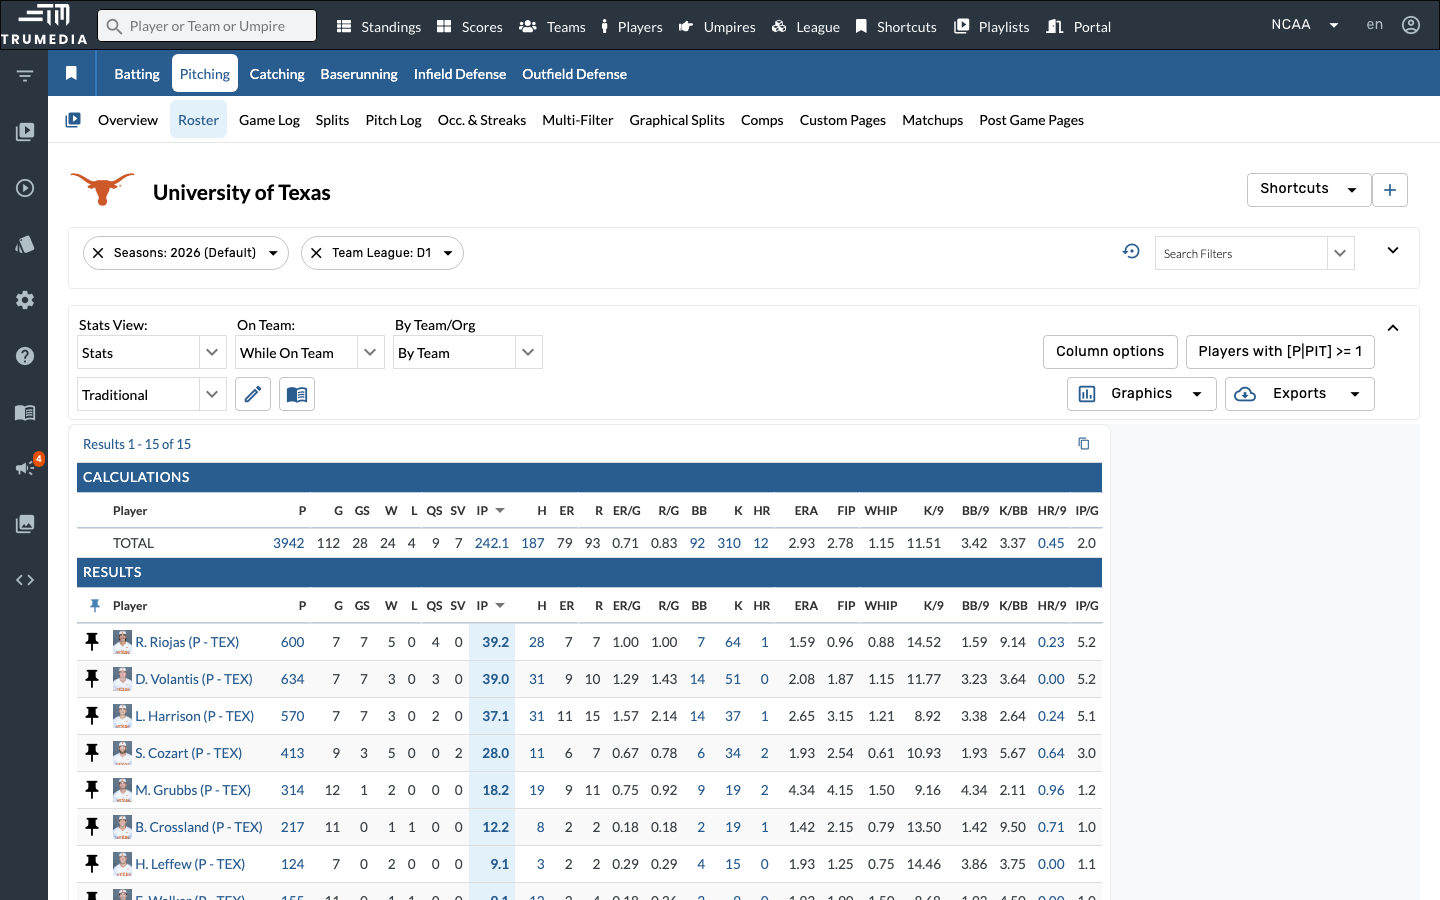
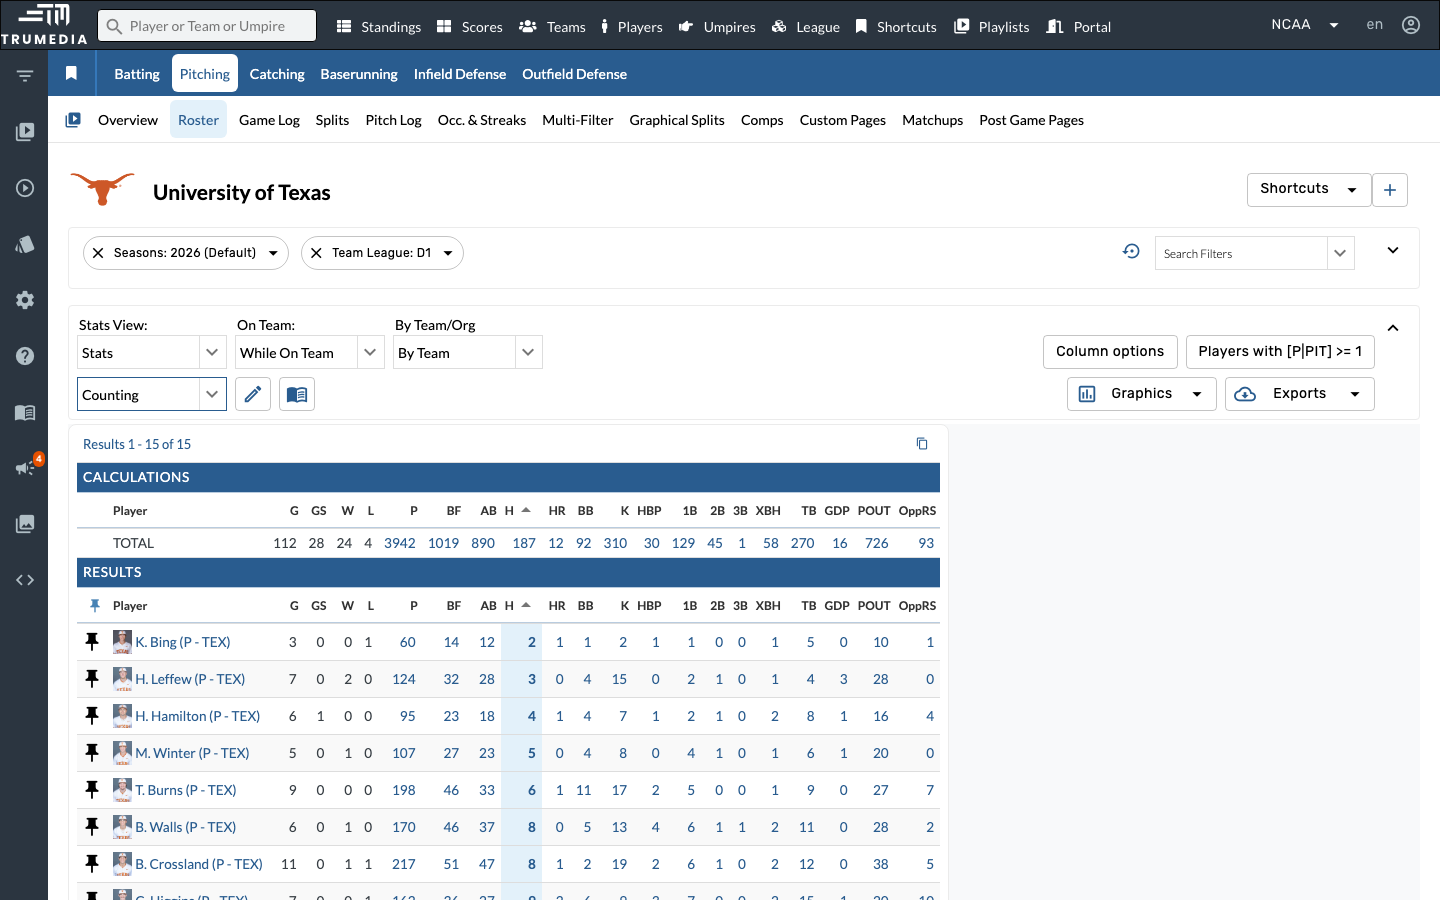
Step 2: Select the Counting report
Click the report dropdown (currently showing Traditional) and select Counting. This switches the table to raw counting stats — hits, extra-base hits, walks, strikeouts — instead of rate-based metrics like ERA or WHIP.
The Counting report is useful when you want to see volume rather than efficiency. A pitcher might have a great ERA but still give up a concerning number of extra-base hits.
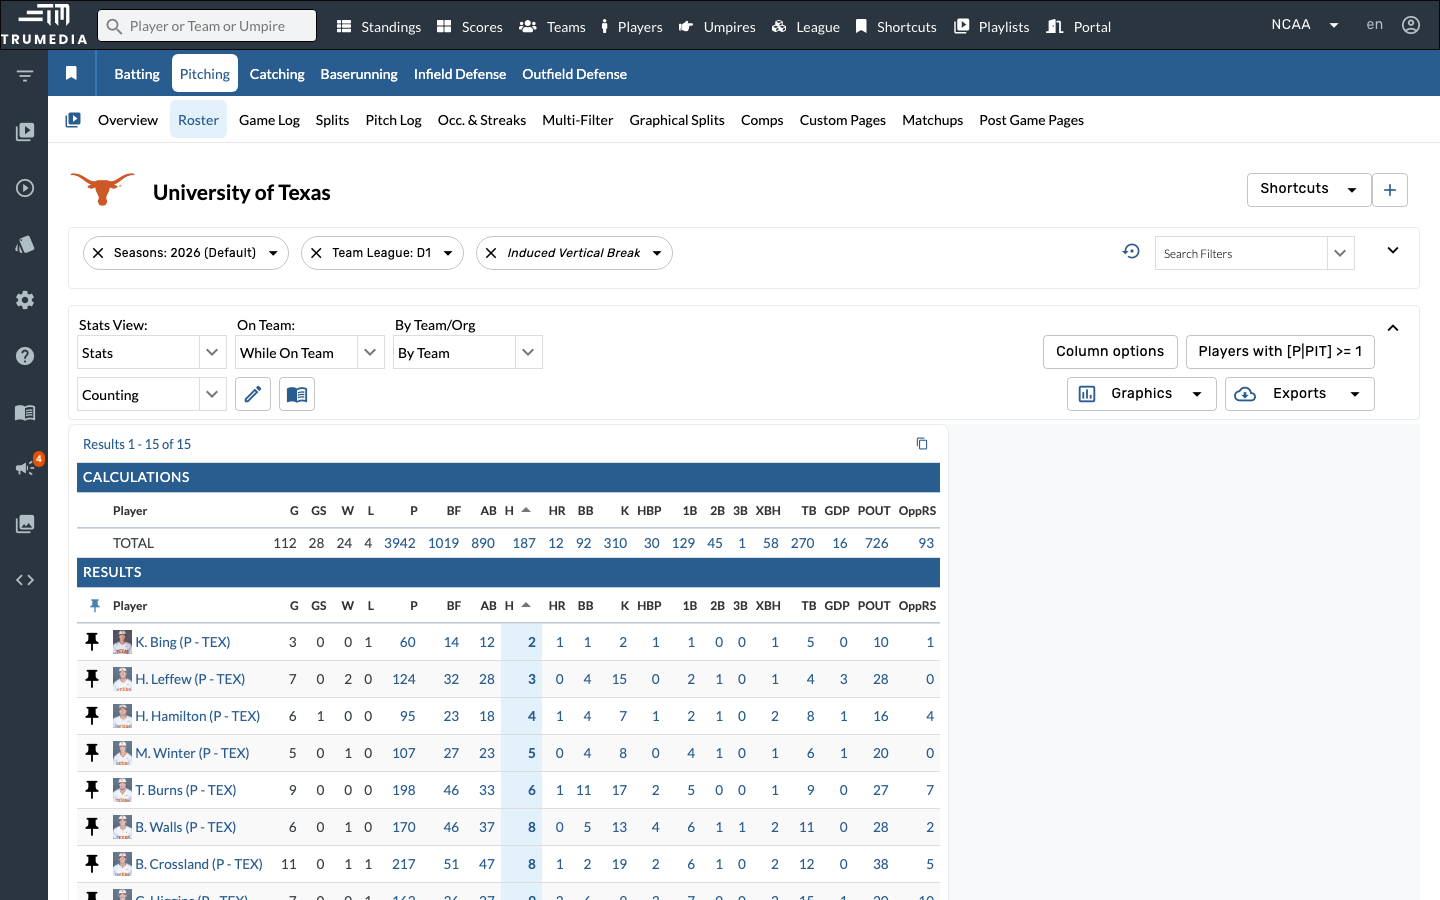
Step 3: Add the Induced Vertical Break filter
Search for Induced Vertical Break in the filter panel and click it to add the filter. Induced vertical break measures how much a pitch rises or drops relative to a gyro ball — higher values indicate more "ride" on the fastball.
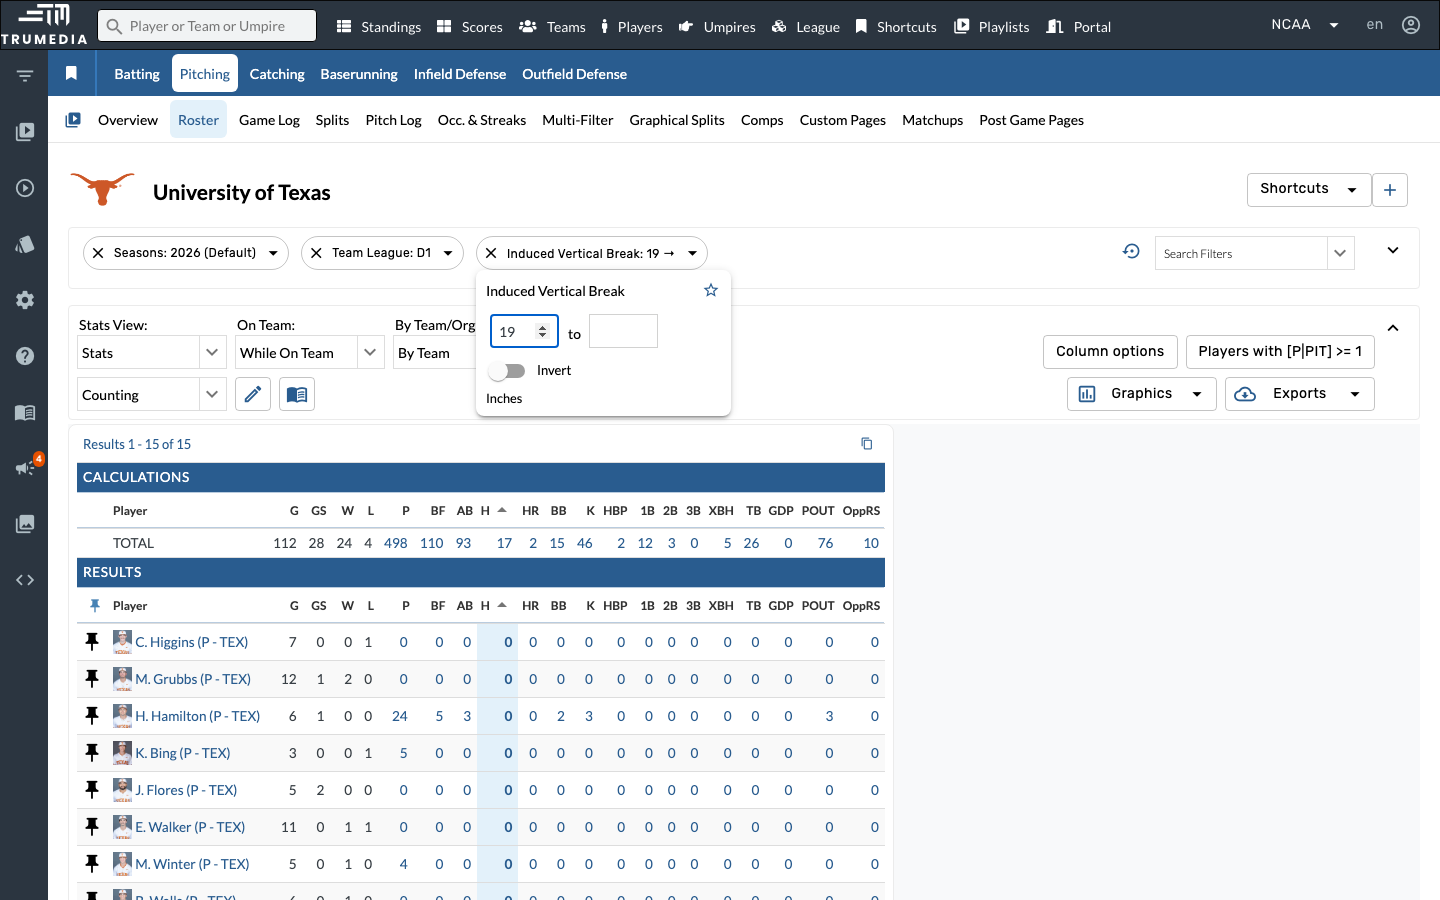
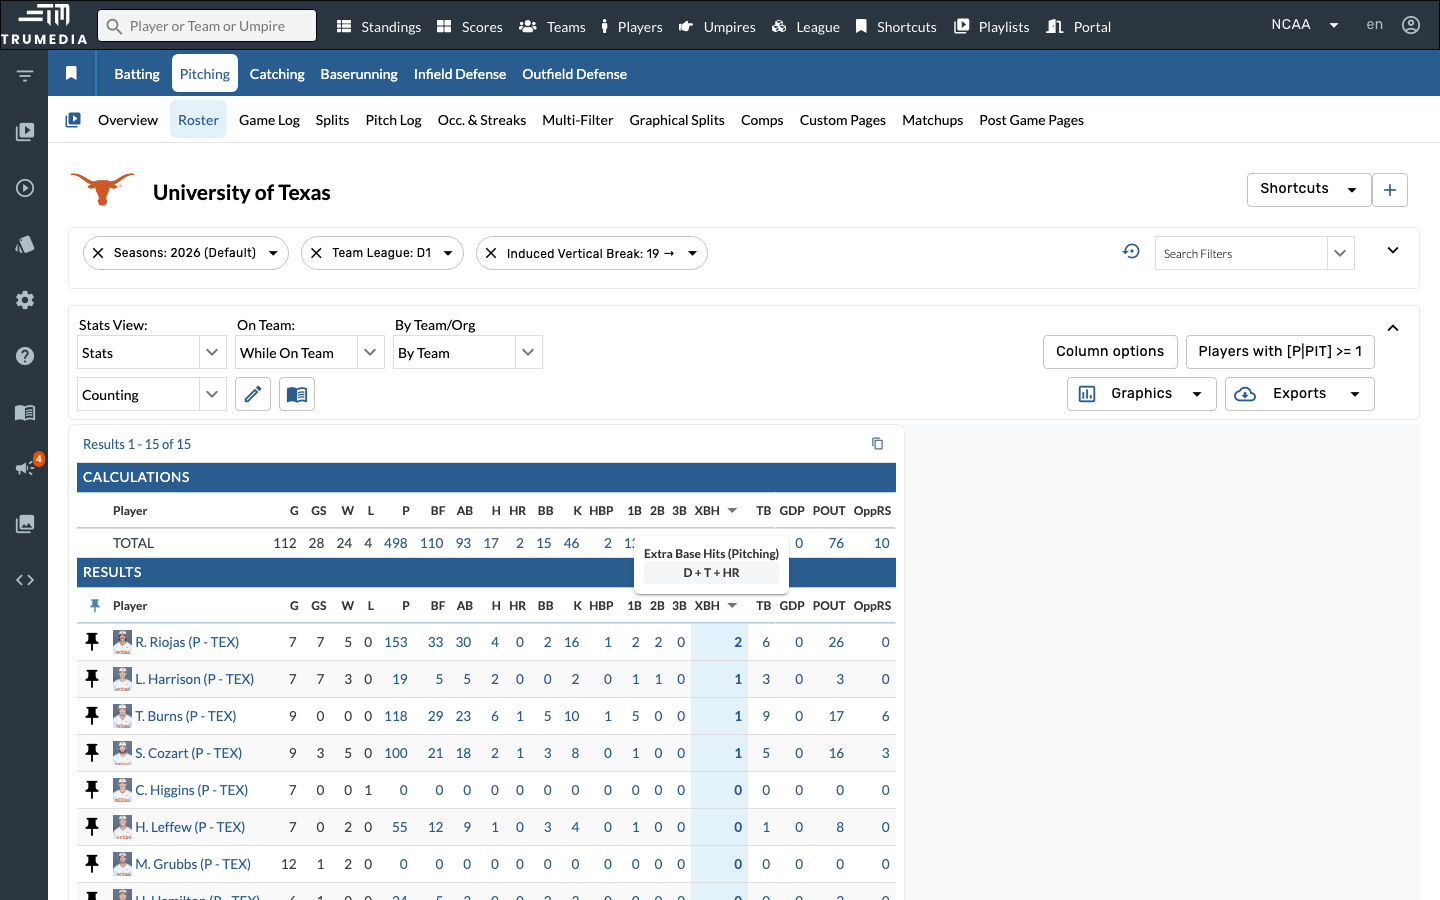
Step 4: Set the lower bound to 19 inches
Set the lower bound to 19 and leave the upper bound blank. This filters for pitches with 19 or more inches of induced vertical break — isolating fastballs with significant ride.
Step 5: Sort by XBH descending
Click the XBH (Extra Base Hits) column header to sort descending. This reveals which pitchers give up the most extra-base hits on high-ride fastballs — a sign that their fastball may not be fooling hitters despite strong vertical break.
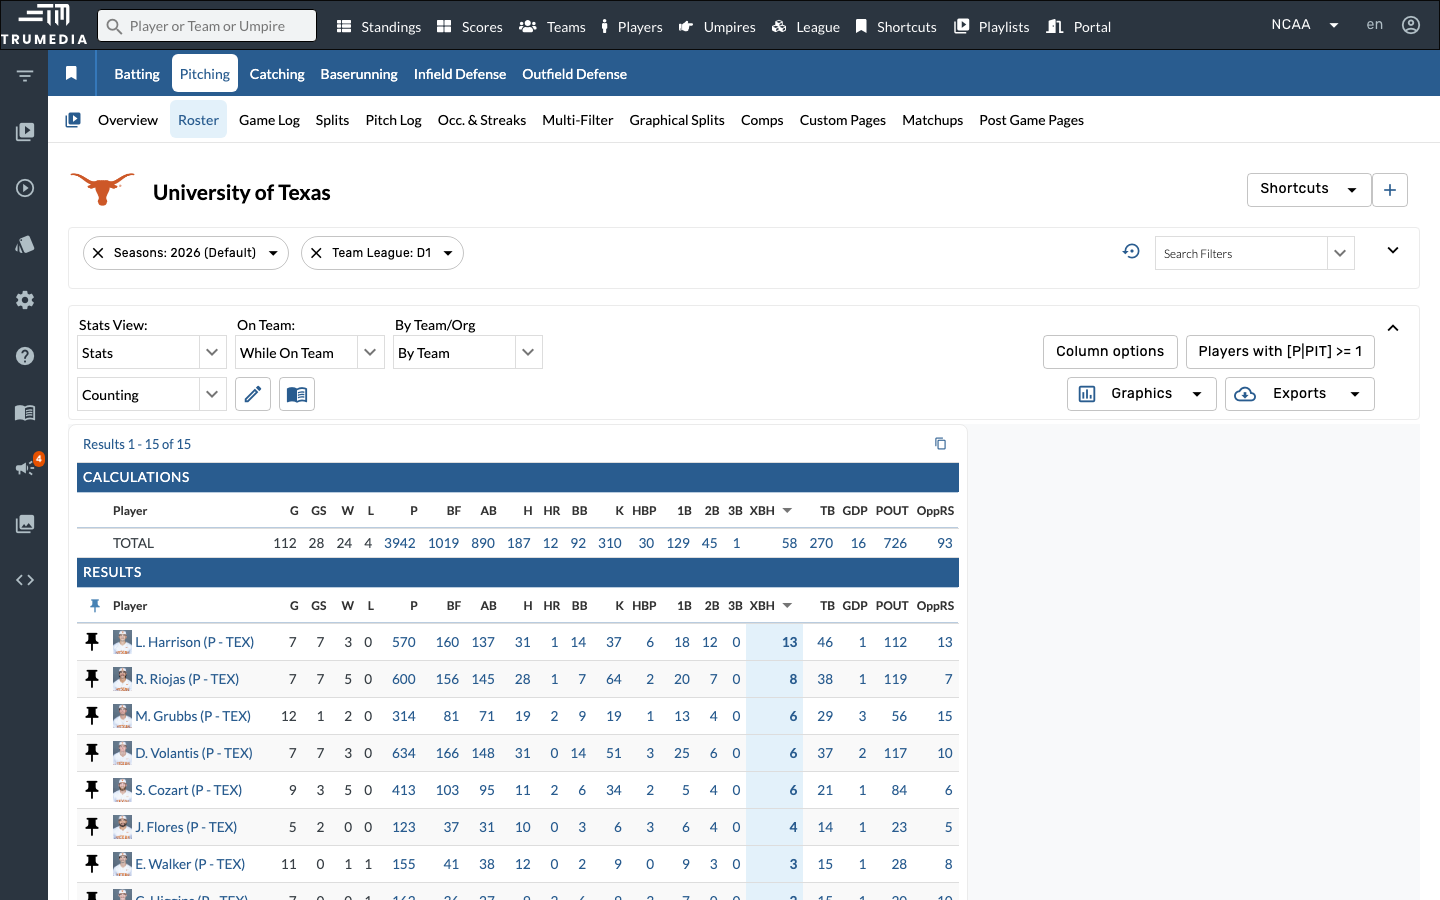
Step 6: Remove the Induced Vertical Break filter
Click the X on the Induced Vertical Break filter chip to remove it. Next, we'll swap in the Horizontal Location filter to analyze XBH from a zone-based perspective instead.
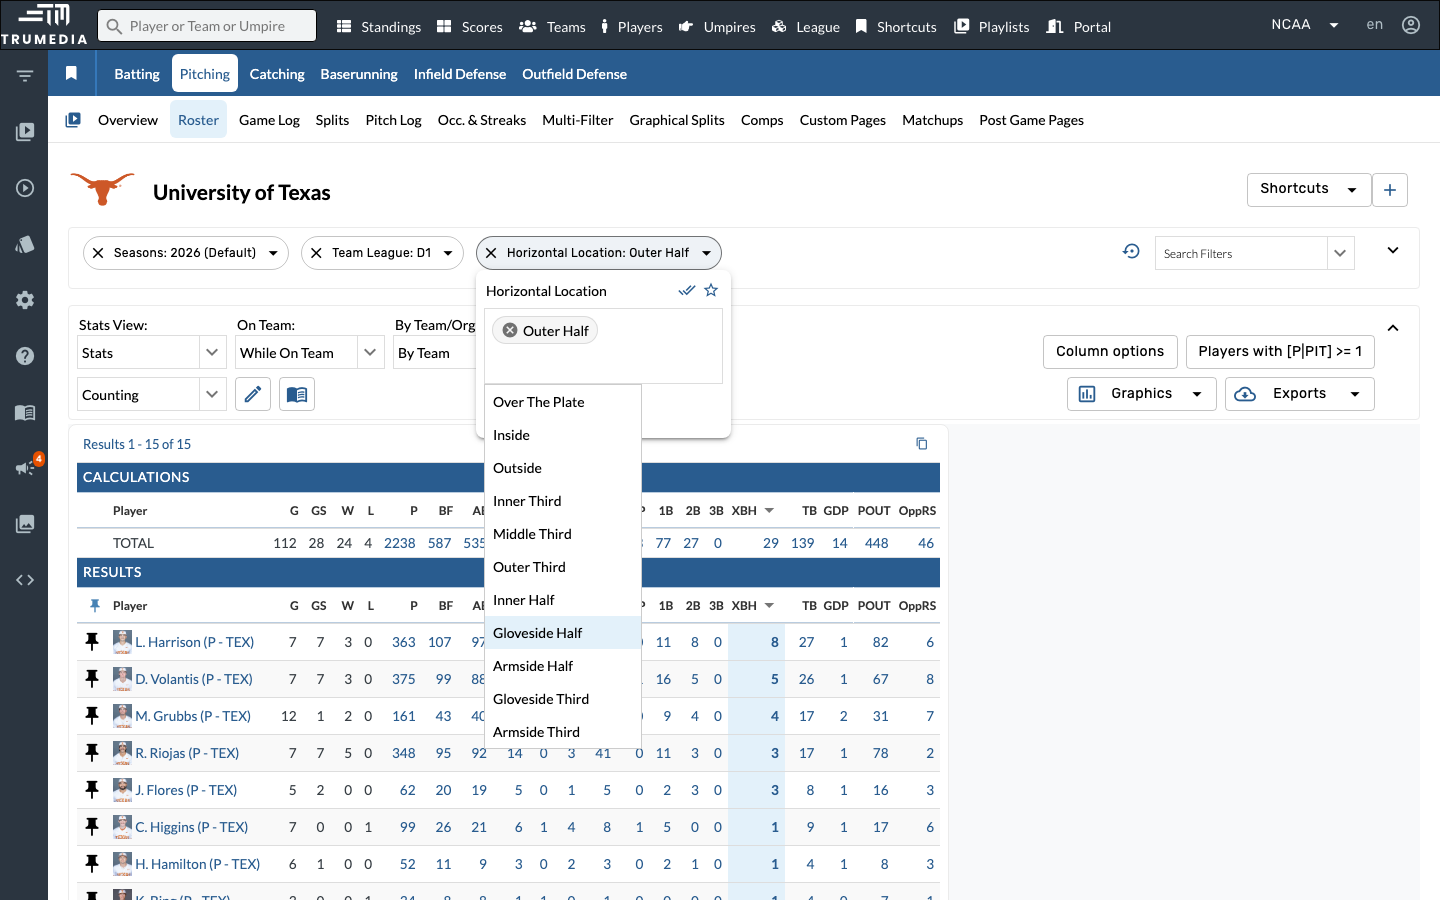
Step 7: Add the Horizontal Location filter
Open Search Filters and click Horizontal Location. This filter splits pitches by where they cross the plate horizontally — inner half, outer half, over the plate, and more.

Step 8: Select Outer Half
Select Outer Half from the Horizontal Location dropdown. The table reloads to show stats on only pitches thrown to the outer half of the strike zone — an area where hitters can extend and drive the ball for extra bases.
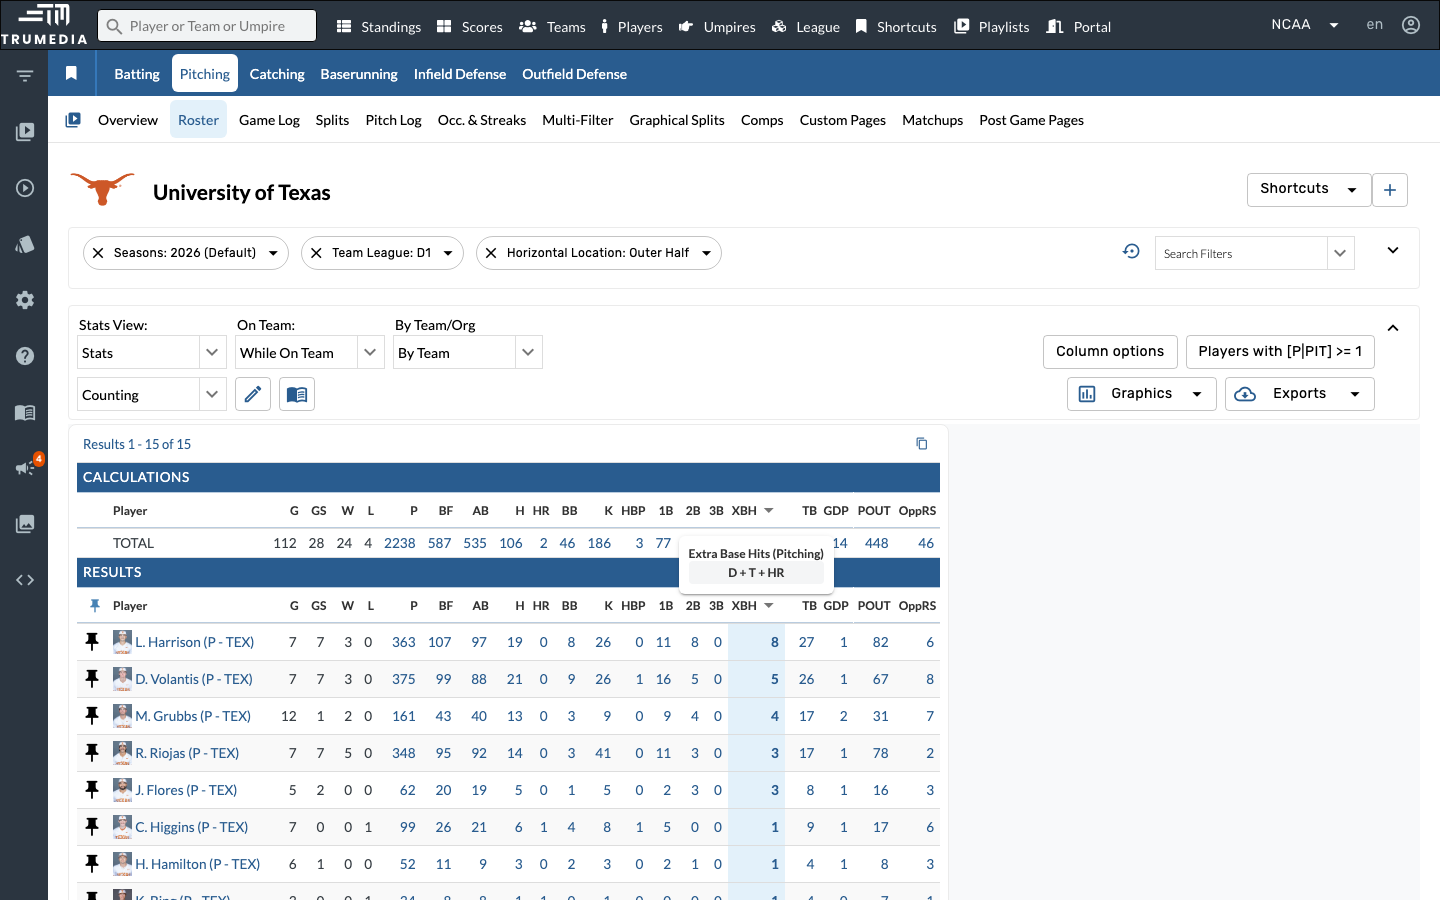
Step 9: Sort by XBH descending
Sort by XBH descending one more time. Now you can see which pitchers on the Texas staff allow the most extra-base hits on outer-half pitches — a different vulnerability profile than the high-ride fastball view you saw earlier.
Key Takeaway
Breaking down extra-base hits allowed by pitch characteristics — like vertical break or horizontal location — reveals which pitchers on a staff are most vulnerable in specific areas. This level of detail helps pitching coaches target mechanical adjustments and helps opponents identify exploitable matchups.