Conference Leaderboards by Specific Parameters
Use TruMedia's filters to see how teams in a conference rank in batting average depending on where pitches are in the strike zone. In this example, we'll look at Clemson within the ACC.
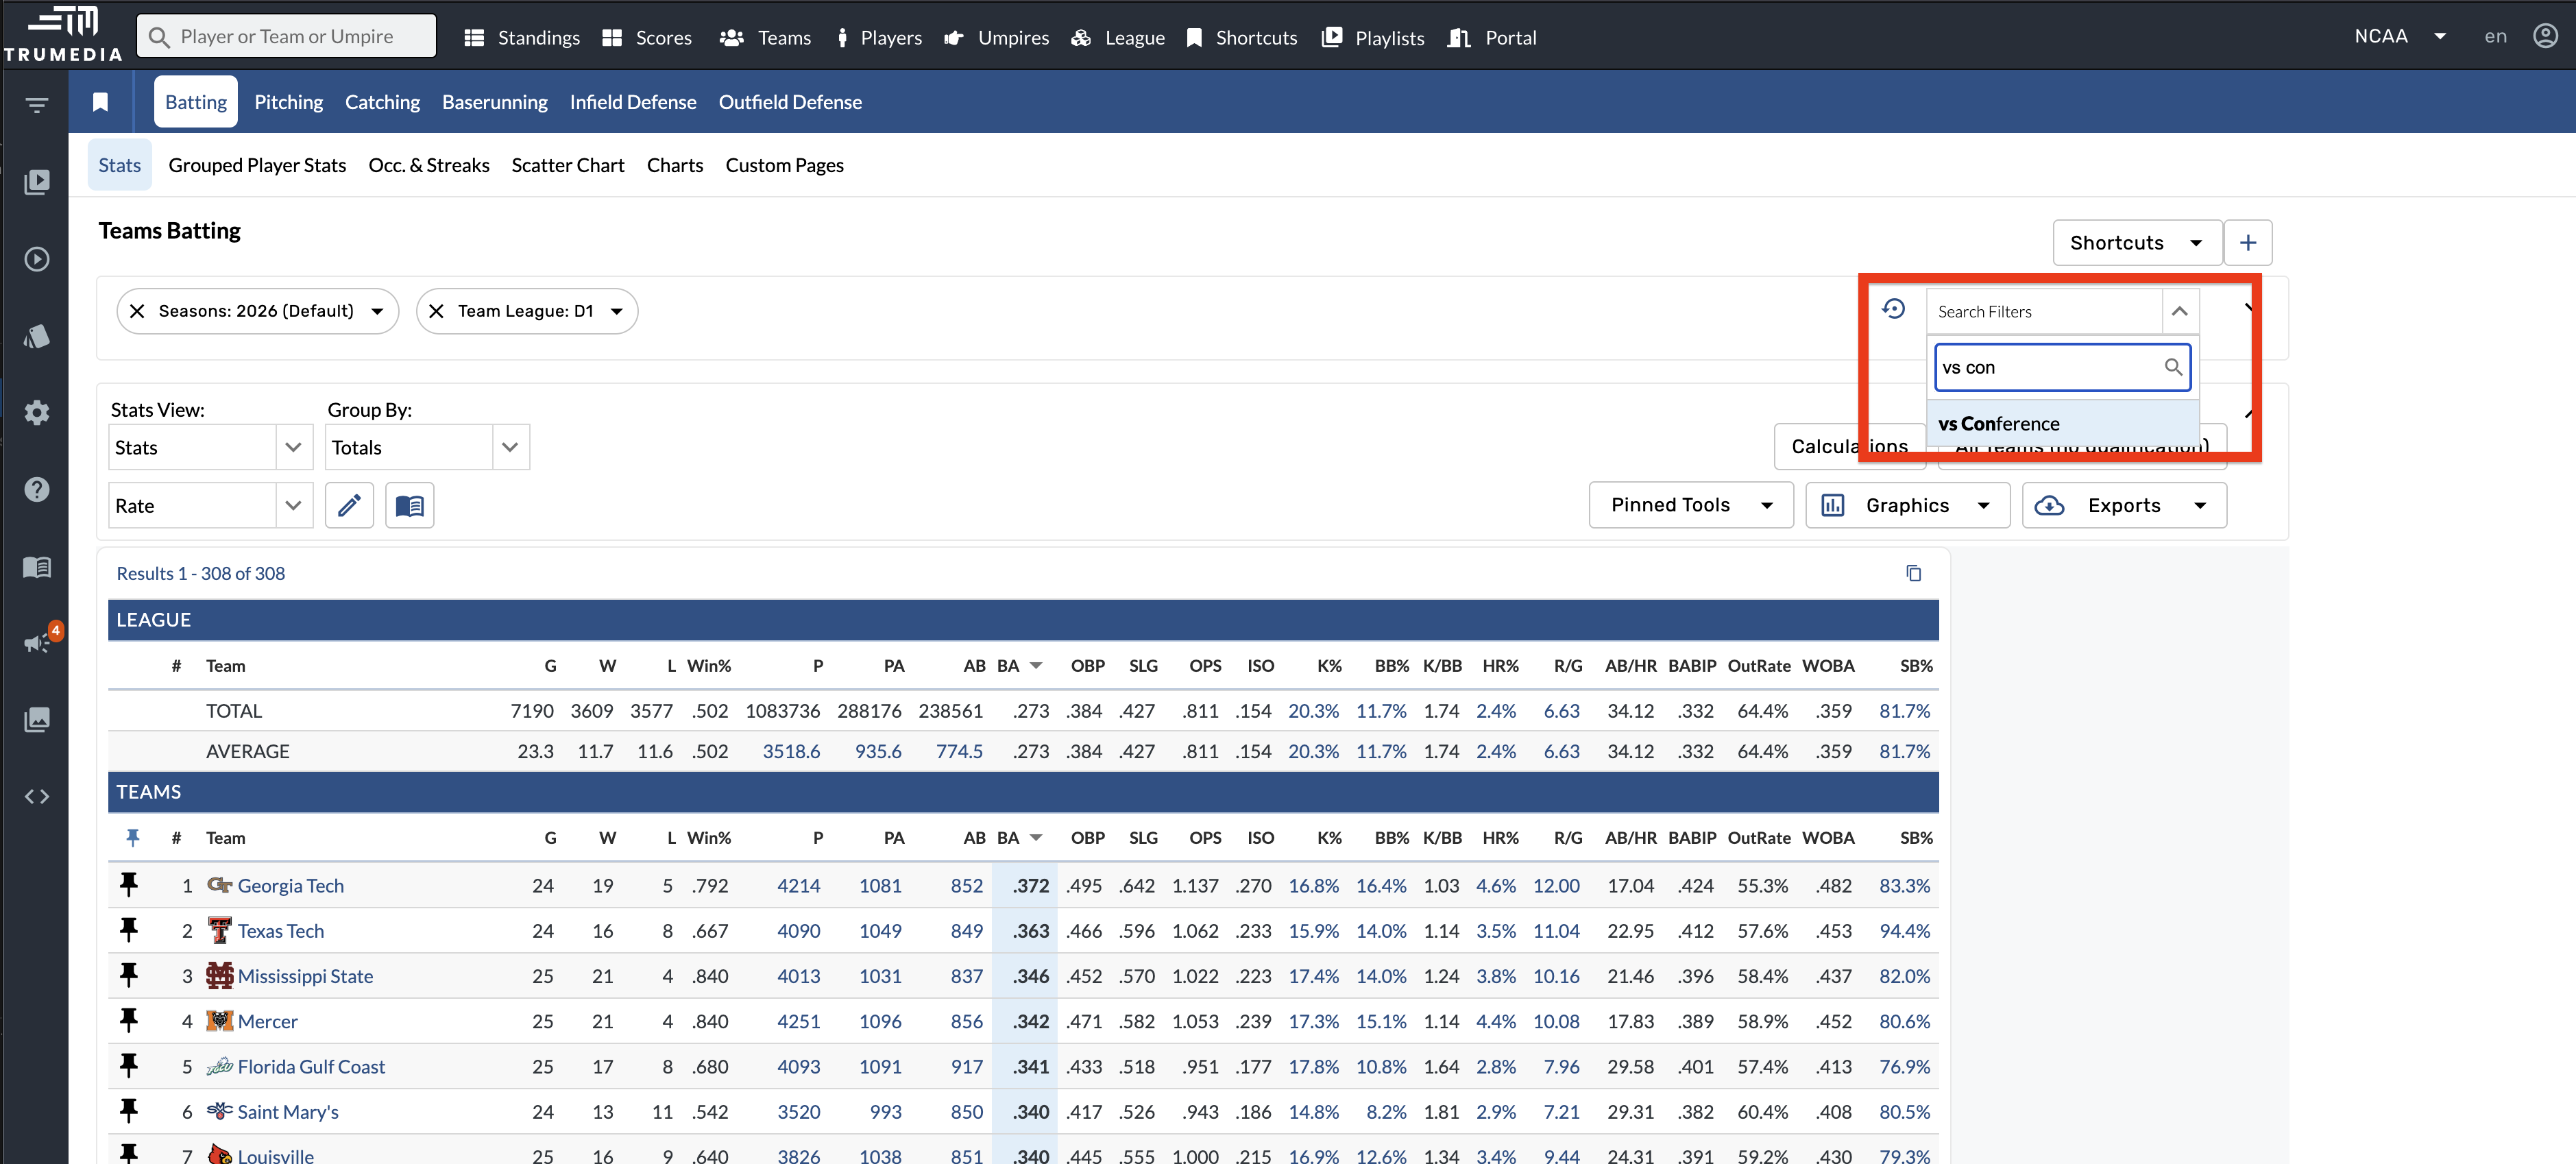
Set Up Conference Filters
Go to the team's batting page. Add a filter for vs Conference and a filter for Current Team Conference to limit the results to only teams in the ACC.
Filter by Upper Third of the Strike Zone
Add a filter for Vertical Location: Upper Third, which limits the data to pitches in the upper third of the strike zone.
Sort by Batting Average to see how teams rank for pitches in the upper third of the zone. You'll see that Clemson is at the top of the list with a .405 batting average.
Filter by Lower Third of the Strike Zone
Change the vertical location filter to Lower Third. You'll see that Clemson is ranked last with a batting average of .151.
Key Takeaway
This is how you can use TruMedia's filters to derive powerful insights quickly. By adjusting a single parameter, you can uncover how a team's performance changes dramatically across different pitch locations.