Pitcher Multi Filter
Use the Multi-Filter tool to compare a pitcher's performance across multiple seasons side by side. In this example, we'll navigate to an Oregon State pitcher's page, set up a 2026 vs. 2025 season comparison using the Multi-Filter tab, and view the Movement report to compare pitch tracking data between seasons.
Difficulty: Intermediate · Estimated time: 5–10 minutes
What You'll Learn
- How to navigate from a team roster to an individual pitcher's Multi-Filter page
- How to add multiple seasons to the top-level Seasons filter
- How to configure multi-filter rows to compare specific seasons side by side
- How to switch the report type to Movement for pitch tracking analysis
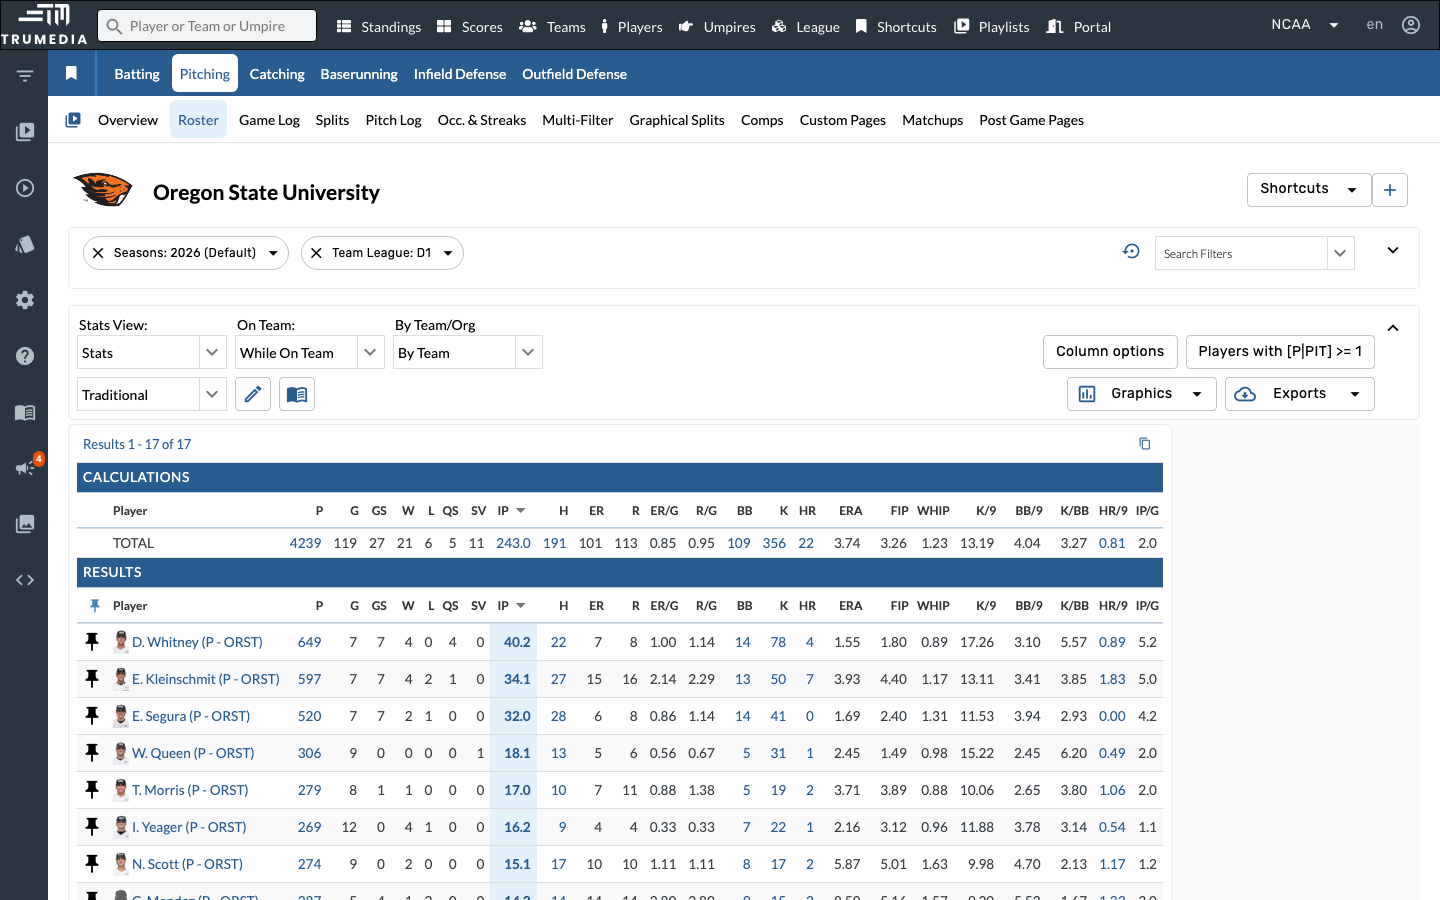
Step 1: Navigate to Oregon State's pitching roster
Go to the Oregon State University team page and select the pitching roster. This shows all pitchers on the roster with their key stats for the current season.
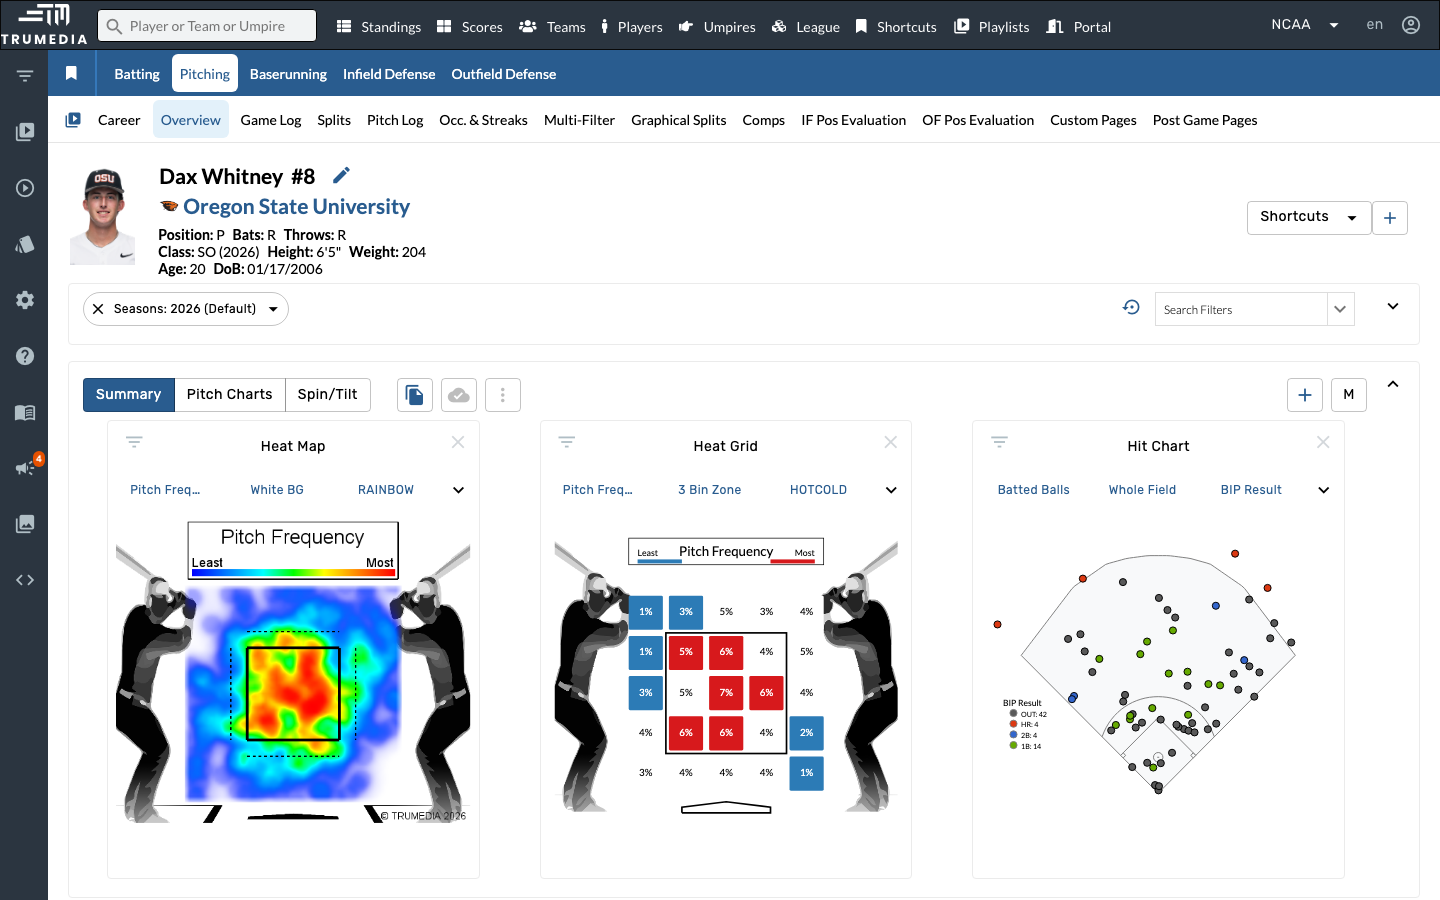
Step 2: Select a pitcher from the roster
Click on the first pitcher in the list to open their individual player page. In this example, we'll use Dan Whitney.
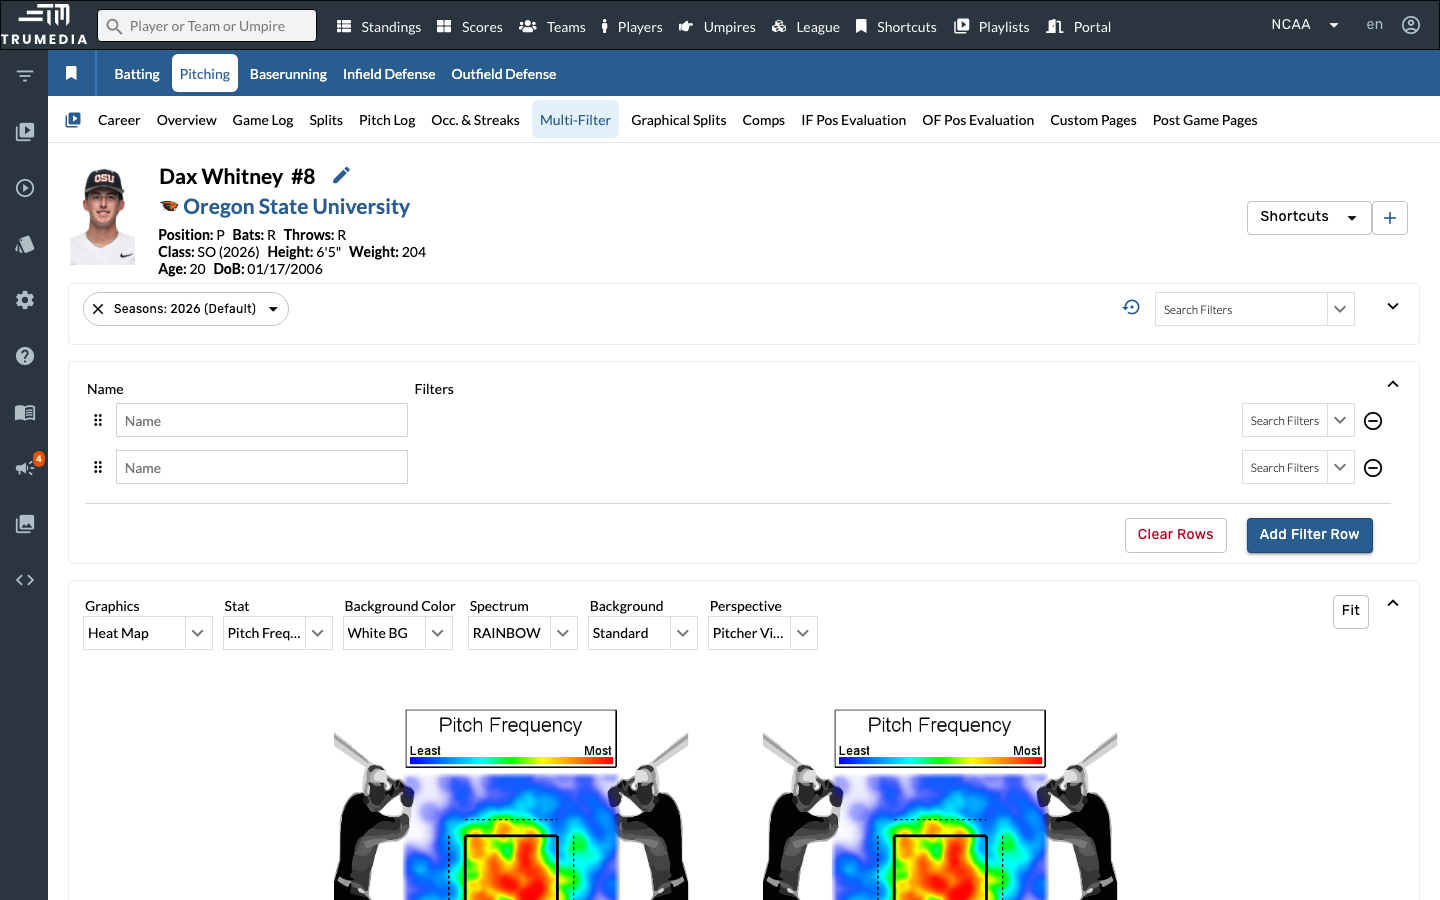
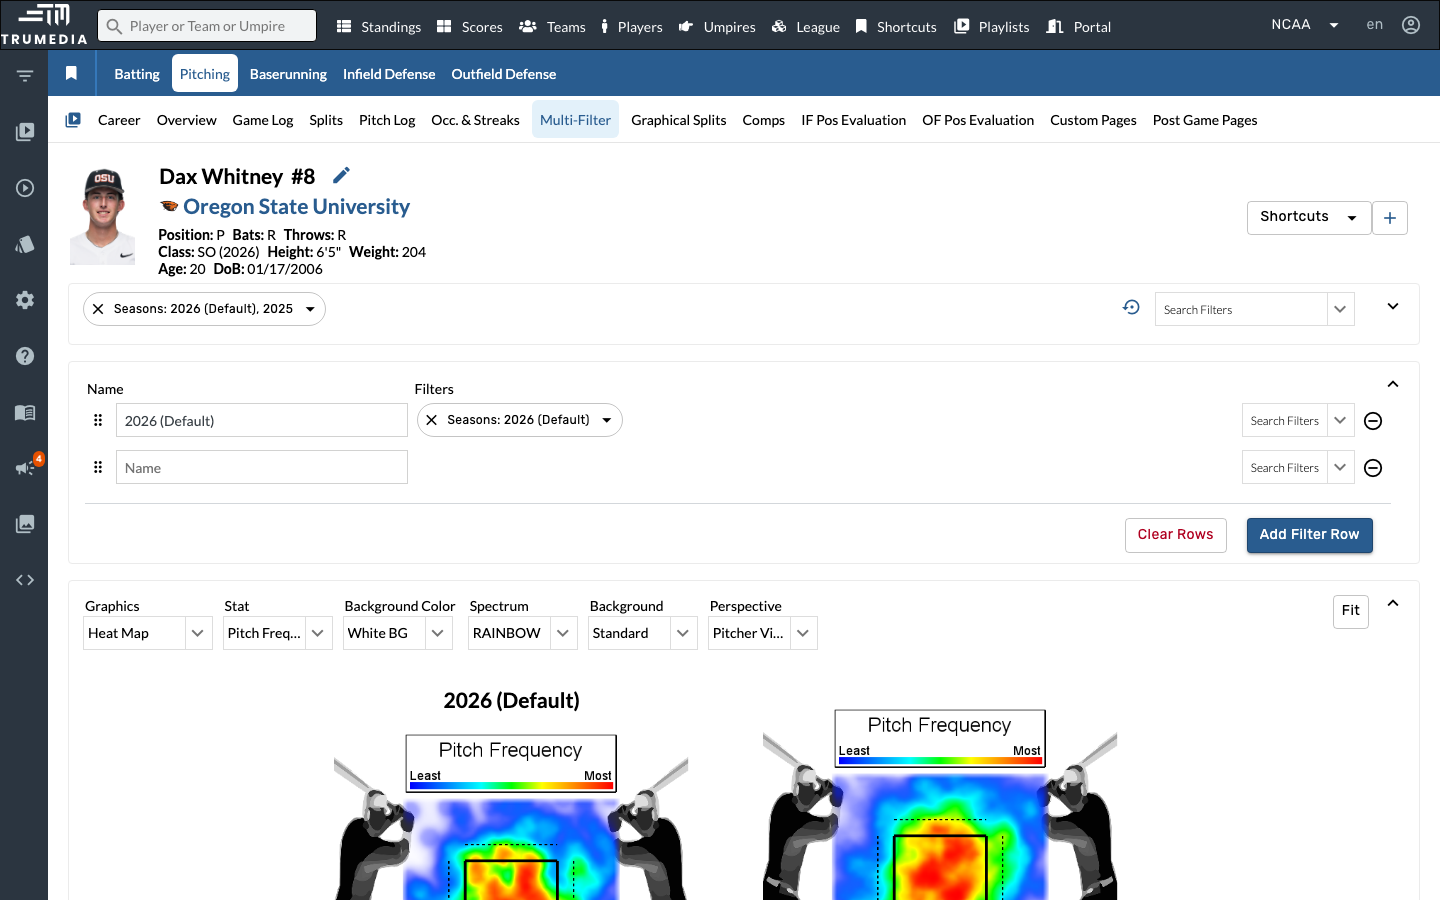
Step 3: Open the Multi-Filter tab
Click Multi-Filter in the player sub-navigation bar. The Multi-Filter page lets you define multiple filter rows and compare stats across different slices of data — such as different seasons, pitch types, or game situations.
Multi-Filter is one of the most powerful analysis tools in TruMedia. Each row acts as an independent filter, and the results are displayed side by side in both the graphics and the stats table.
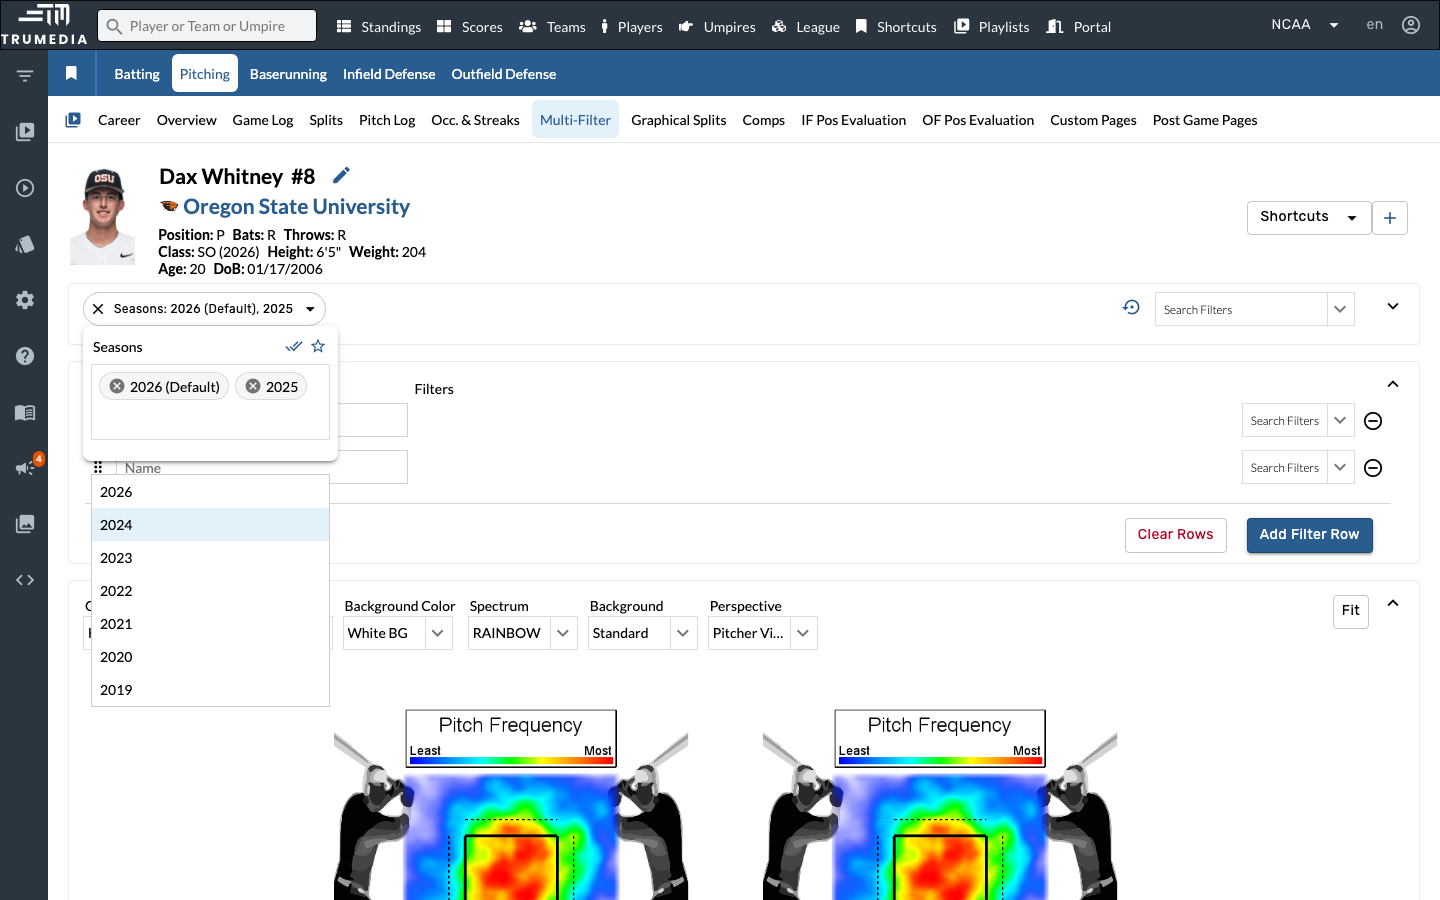
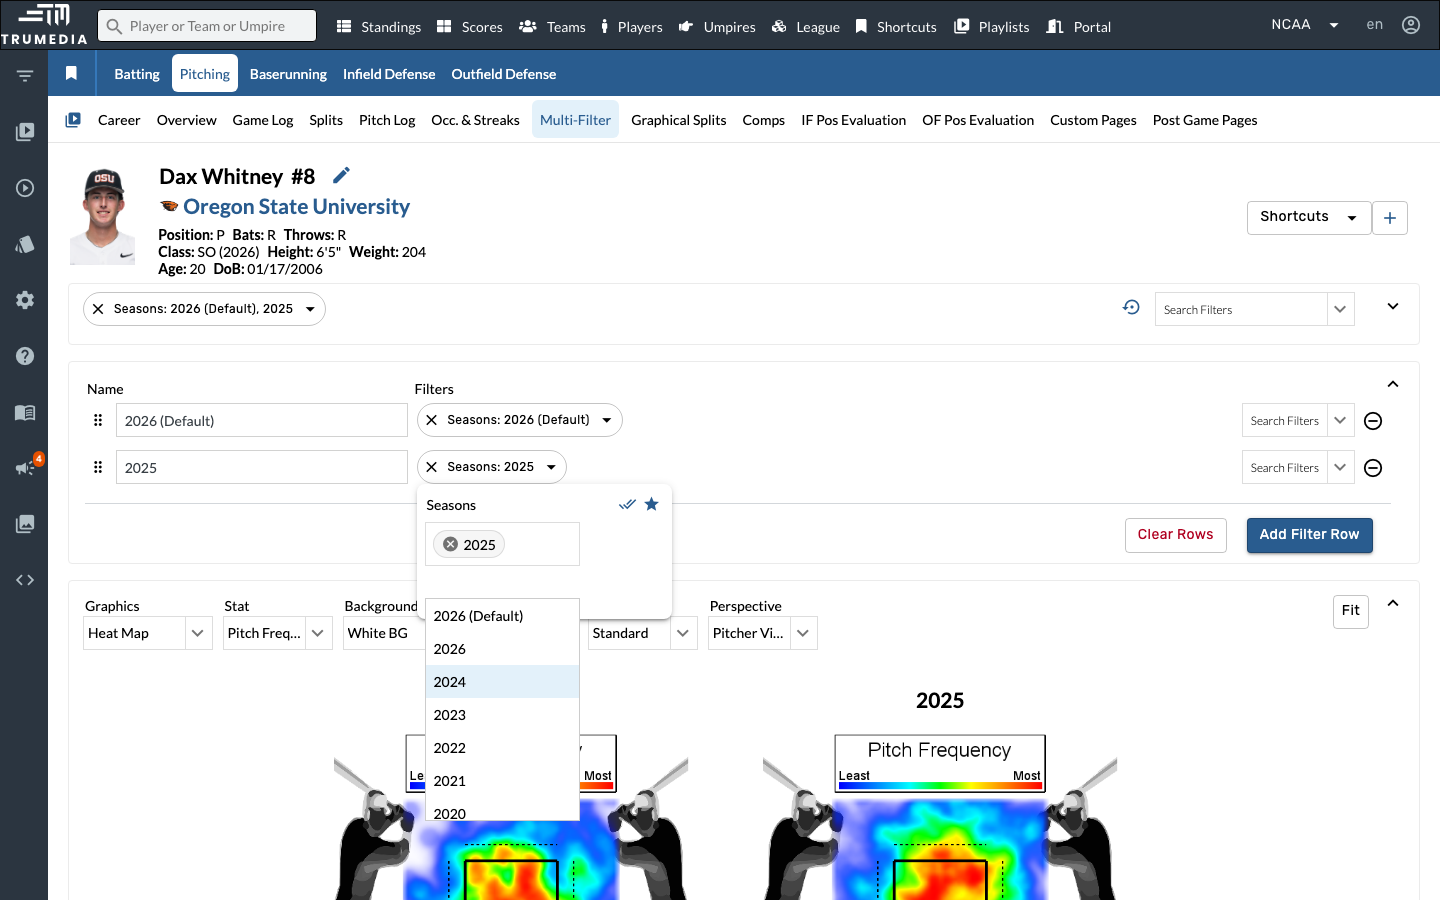
Step 4: Add 2025 to the Seasons filter
Open the Seasons filter dropdown and select 2025 alongside the default 2026 season. Adding both seasons to the top-level filter makes them available as options in the multi-filter rows below.
Step 5: Set the first filter to Seasons 2026
In the multi-filter configuration area, expand the first filter row and click Seasons from the available filters. The row automatically defaults to 2026 (Default), which is what we want for the first comparison.
Step 6: Set the second filter to Seasons 2025
For the second filter row, add a Seasons filter, then change it from the default 2026 to 2025. This creates a side-by-side comparison: the first row shows 2026 data and the second shows 2025 data.
The graphics and table below will now display results for both seasons, making it easy to spot year-over-year changes.
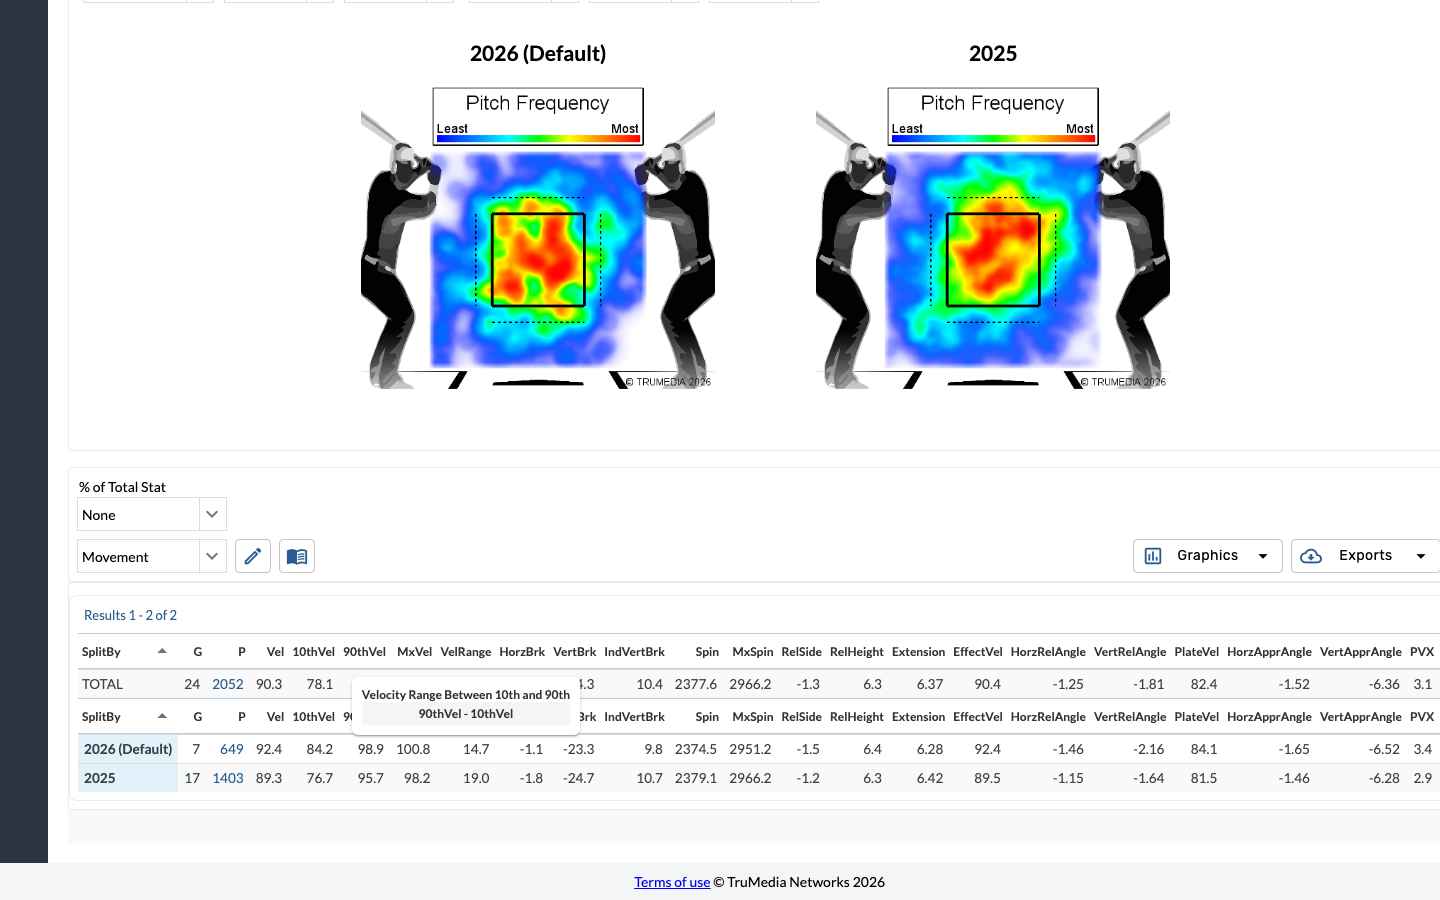
Step 7: Select the Movement report
Scroll down to the reports section and change the report type from Traditional to Movement. The stats table reloads with pitch tracking metrics — velocity, spin rate, horizontal and vertical break, release point, and more — split into separate rows for 2026 and 2025.
The Movement report is especially useful for tracking pitcher development. Changes in velocity, spin rate, or break between seasons can indicate mechanical adjustments, improved conditioning, or the addition of a new pitch.
Key Takeaway
The Multi-Filter tool lets you layer multiple season filters side by side, making it easy to compare year-over-year changes in a pitcher's movement profile, velocity, and spin. This is invaluable for tracking pitcher development and identifying mechanical changes between seasons.