Catcher Block Chart
- Basic Usage
- Use Cases
- Recent Updates
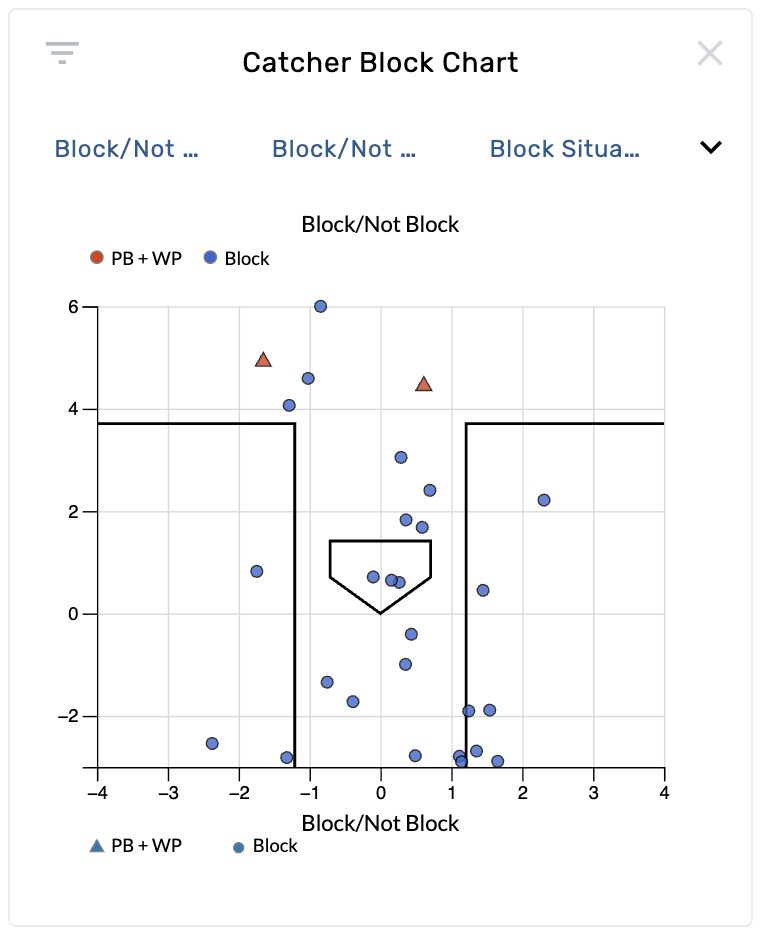
The Catcher Block Chart shows pitch locations from a top-down perspective, visualizing where pitches end up on the ground in front of the catcher. Each point represents an individual pitch, color-coded and shape-coded by blocking outcome. The chart renders the batter's box, home plate, and a coordinate grid measured in feet.
By default the chart filters to block situations only — pitches where there are two strikes or runners on base. This focuses the view on high-leverage moments where blocking matters most.
Settings
| Setting | Options | Description |
|---|---|---|
| Color By | Block/Not Block (default), Wild Pitch/Passed Ball/Block, Whiff/Hard/Other, Pitch Result, Pitch Outcome, Swing/Take, In/Out Zone, Pitch Type, and more | Controls the color coding of each point. |
| Shape By | Block/Not Block (default), and other categorical options | Controls the shape of each marker (e.g., circles vs. triangles). |
| Pitches | Block Situations Only (default), All | "Block Situations Only" filters to two-strike counts or runners on base. "All" shows every pitch. |
| Ball Size | Normal, Small (default), Tiny | Controls the size of each point marker. |
| Limit to Last __ Balls | 0–2000 | Filters the data to show only the most recent N pitches. Set to 0 for no limit. |
Reading the Chart
- Blue circles (by default) represent pitches that were successfully blocked.
- Red triangles represent passed balls or wild pitches.
- The home plate outline and batter's box boundaries provide spatial context.
- The X-axis shows horizontal ground position (feet), and the Y-axis shows depth (feet).
- Drag selection is supported — draw a rectangle on the chart to filter to a specific ground location area.
Evaluate a catcher's blocking ability
Open a catcher's page and navigate to the Catcher Block Chart. The default Block/Not Block color and shape settings immediately show which pitches in the dirt were blocked (blue circles) versus which got past the catcher (red triangles). Look for clusters of red markers to identify problem areas.
Compare blocking against lefties vs. righties
On catching pages, the chart is shown in two instances — one for left-handed pitchers and one for right-handed pitchers. Compare the two to see if a catcher struggles more with pitches from one side, which can inform bullpen pairing decisions.
Identify blocking weaknesses by location
Set Pitches to Block Situations Only and look at where passed balls and wild pitches concentrate. If red markers cluster on the glove side versus the backhand side, that reveals a directional weakness worth addressing.
Scout blocking in all pitch situations
Switch Pitches to All to see the full picture of how the catcher handles pitches in the dirt regardless of game situation. Set Color By to Pitch Type to see if certain pitch types (e.g., curveballs, sliders) are harder for the catcher to block.
December 3rd, 2025
- New graphic: The Catcher Block Chart was added, visualizing a catcher's pass block performance from a top-down view. Defaults to showing all balls likely in the dirt (based on pitch trajectory) in blocking situations.
- Native graphic set added to catching pages showing block performance against both lefties and righties.
- New filters introduced: Pitch Ground Y, Pitch Ground X, Pitch Block Situation, Ball Likely in Dirt.