Bat Contact Grid
- Basic Usage
- Use Cases
- Recent Updates
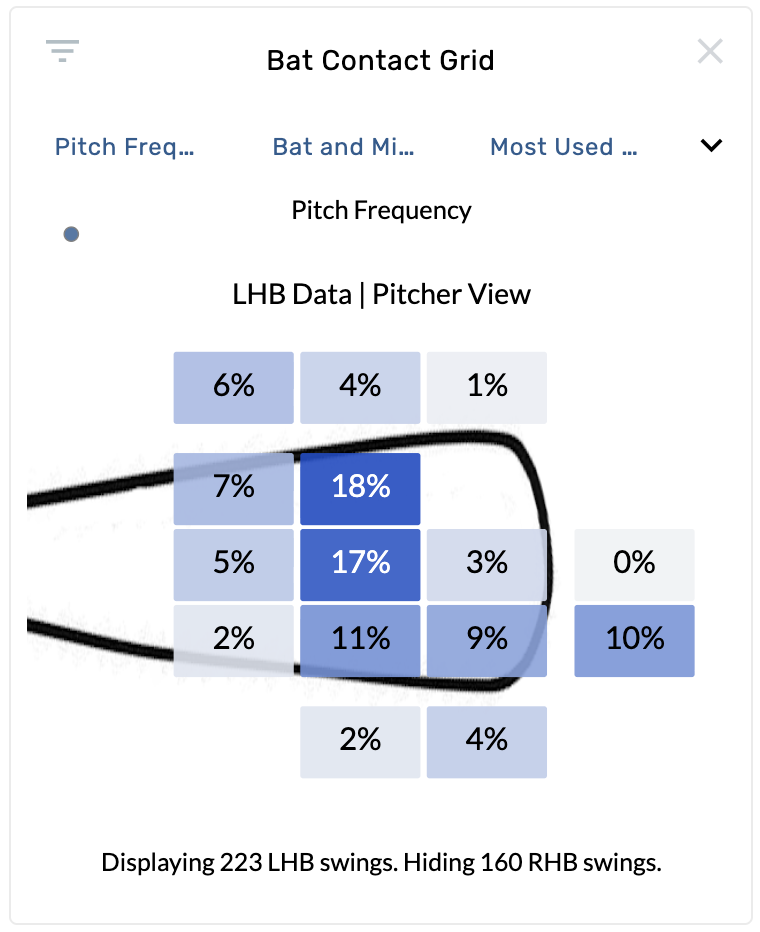
The Bat Contact Grid displays where a batter makes contact on the bat, broken into nine zones relative to the sweet spot. Each cell shows a percentage or stat value, giving you a quick read on contact quality and distribution. This graphic requires Statcast bat tracking data and is available on batting and pitching report types.
Settings
| Setting | Options | Description |
|---|---|---|
| Color By | Pitch Frequency, Exit Velocity, Barrel%, Foul%, HR%, xAvg, xWOBA, xSLG, xISO, Launch Angle | Controls which metric colors each grid cell. |
| Zoom | Bat and Misses, Bat Only | "Bat and Misses" shows the full area including swings that missed. "Bat Only" zooms in to only show swings that made contact. |
| Batter Hand | Most Used Side Only, Both - Right Display, Both - Left Display | "Most Used Side Only" filters to the batter's primary hand. The "Both" options combine all swings and orient them as either a right-handed or left-handed view. |
| Perspective | Pitcher View, Catcher View | Flips the grid orientation between the pitcher's and catcher's point of view. |
| Bin Sizing | None, Count | When set to "Count", the size of each grid cell scales based on how many events fall in that zone. |
Grid Zones
The grid is divided into nine contact zones relative to the bat's sweet spot:
- Sweet Spot — center of the grid, the ideal contact point
- Above / Below Sweet Spot — vertical offset from center
- End of Barrel / Handle of Barrel — horizontal offset along the bat
- Corner zones — combinations of vertical and horizontal offset (e.g., Handle Above Barrel, End Below Barrel)
When "Bat and Misses" zoom is selected, additional miss zones appear around the grid showing where swings missed entirely.
Evaluate a hitter's contact quality
Open a batter's page and select the Bat Contact Grid. Set Color By to Exit Velocity to see which zones produce the hardest contact. Compare the sweet spot zone to the corner zones to understand how much a hitter's production drops off when contact moves away from the barrel center.
Compare contact profiles across batter hands
On a pitcher's page, use the Batter Hand setting to toggle between Both - Right Display and Both - Left Display. This reveals whether the pitcher tends to get hitters to mis-hit in different zones depending on handedness.
Identify swing-and-miss tendencies
Set Zoom to Bat and Misses and Color By to Pitch Frequency. The miss zones around the grid show where a hitter swings and misses most often, which can inform pitch sequencing strategy.
Assess barrel rate by zone
Set Color By to Barrel% and Bin Sizing to Count. Larger, darker cells represent zones where the hitter makes frequent, high-quality contact. Small, light cells indicate zones that rarely produce barrels — useful for identifying a hitter's cold spots.
No release notes have been published for the Bat Contact Grid yet. Check back for updates as new features and enhancements are released.