Event Time Series Charts
-
Graphics - Team & Player Pages
-
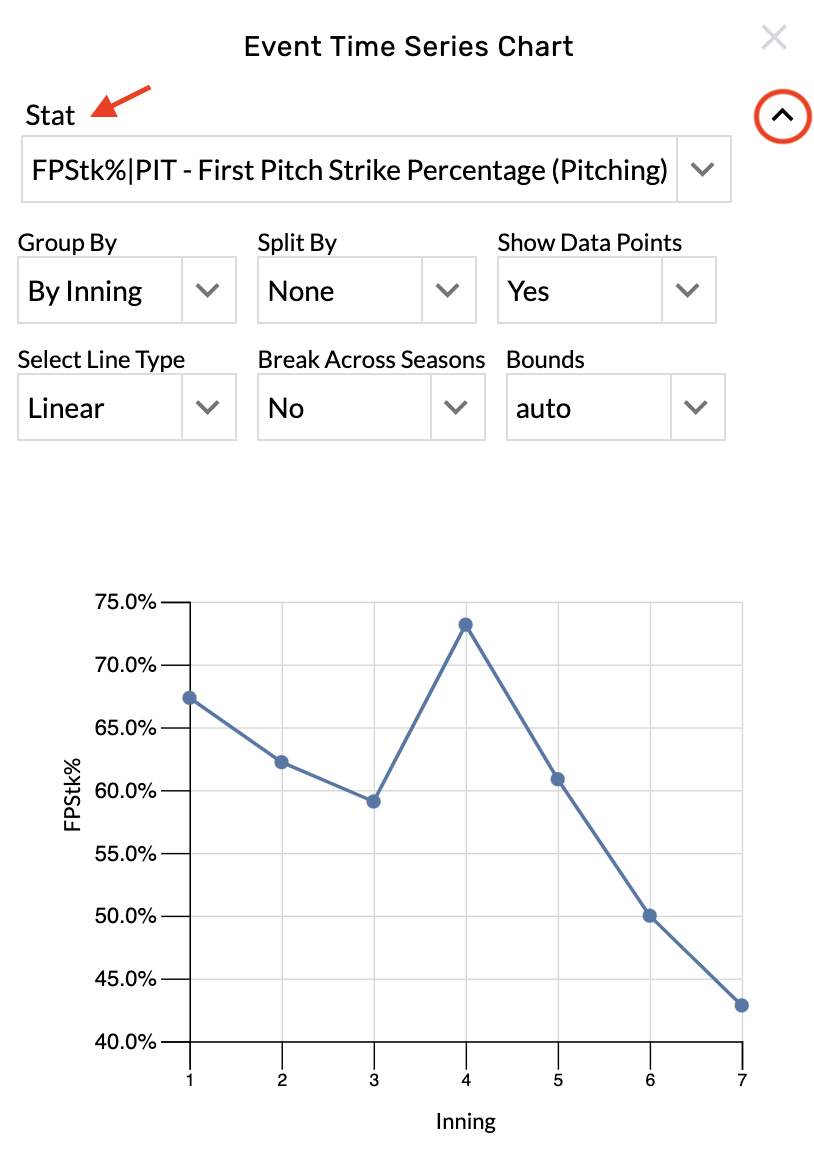
Open the graphic settings.
-
Choose from the Stat menu.
Change the time interval
-
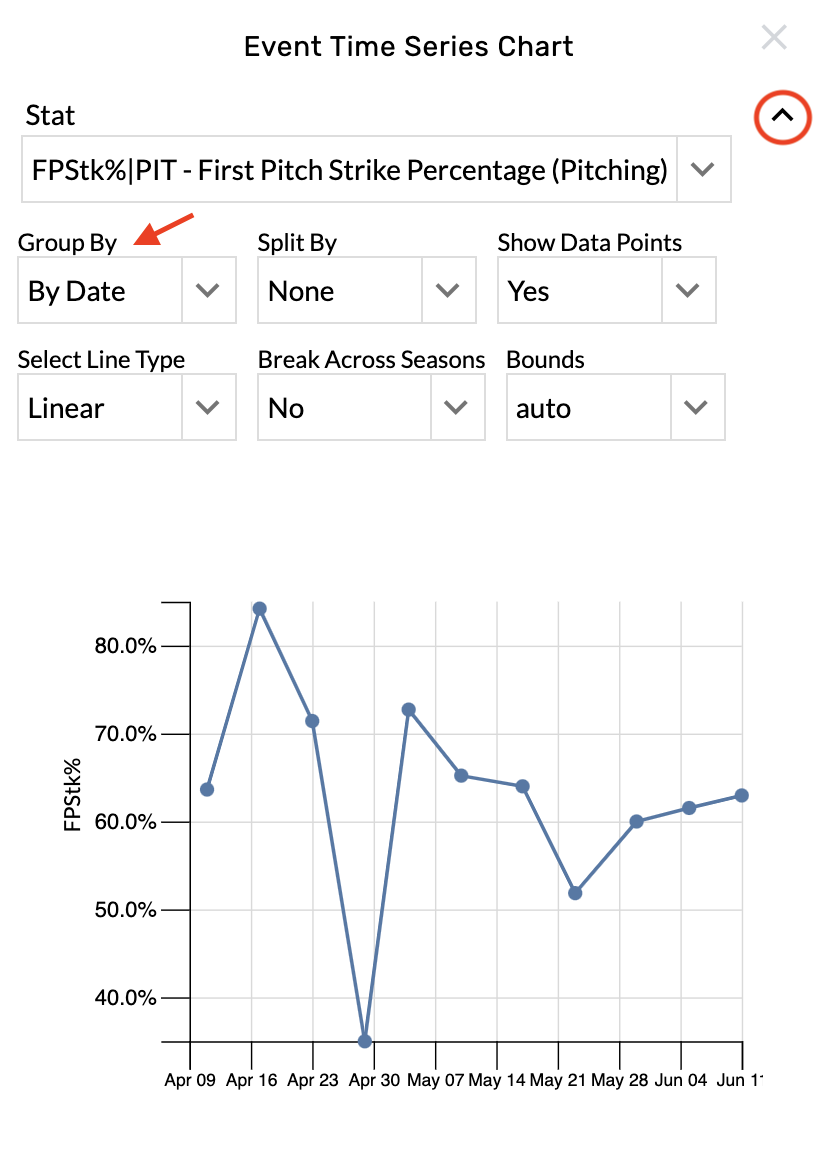
Open the graphic settings.
-
Choose from the Group By menu.
Hide the data points
-
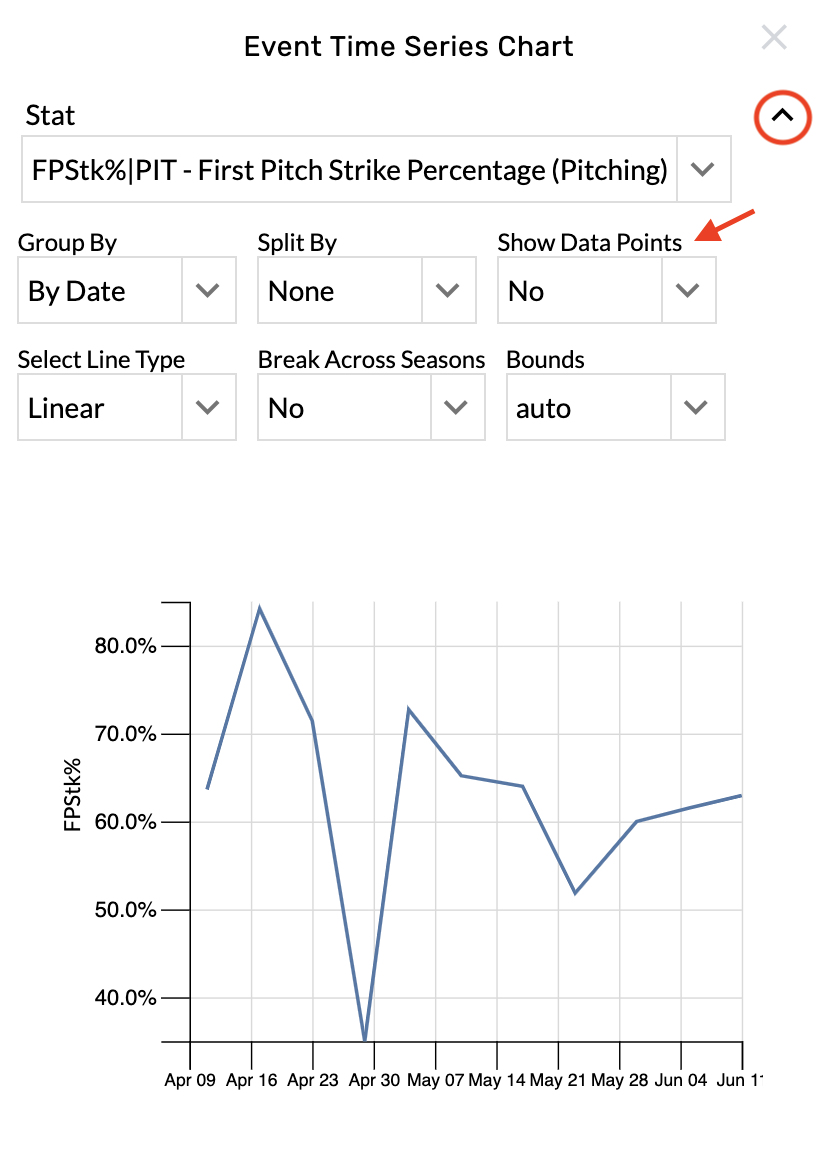
Open the graphic settings.
-
Choose No from the Show Data Points menu.
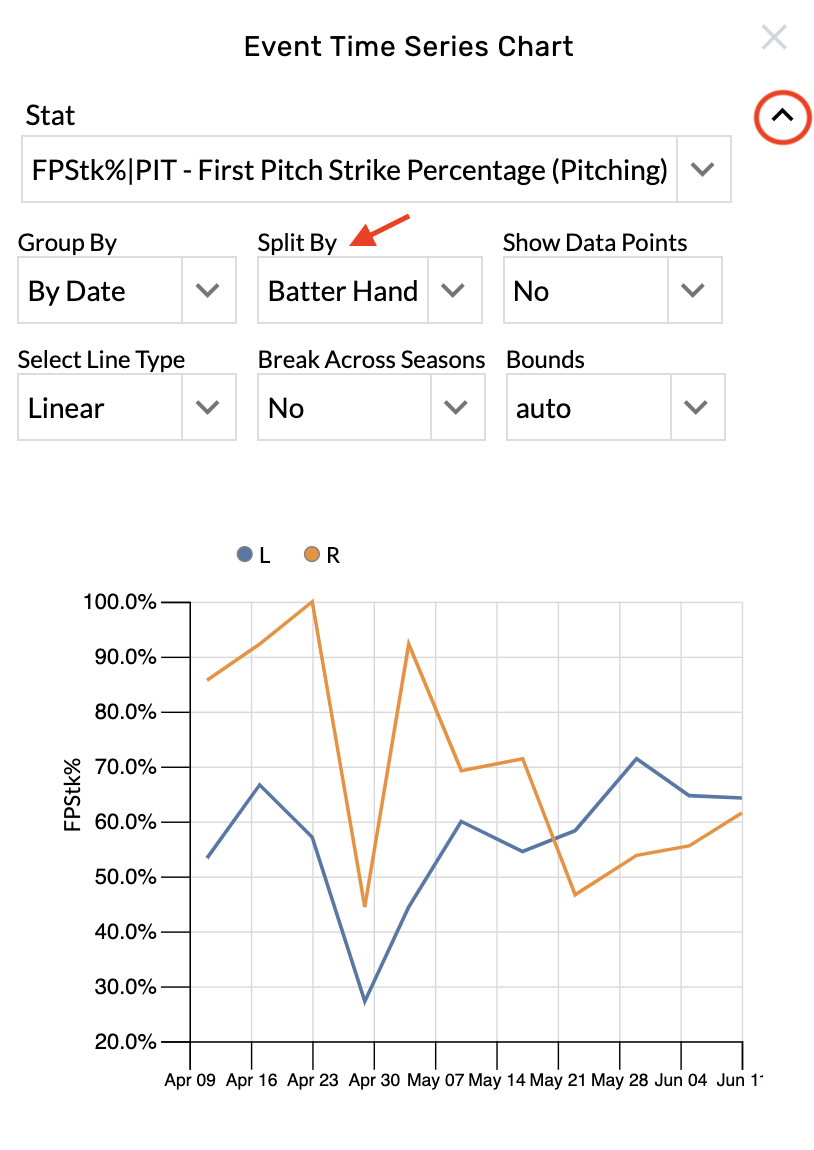
Apply splits
-
Open the graphic settings.
-
Choose from the Split By menu.
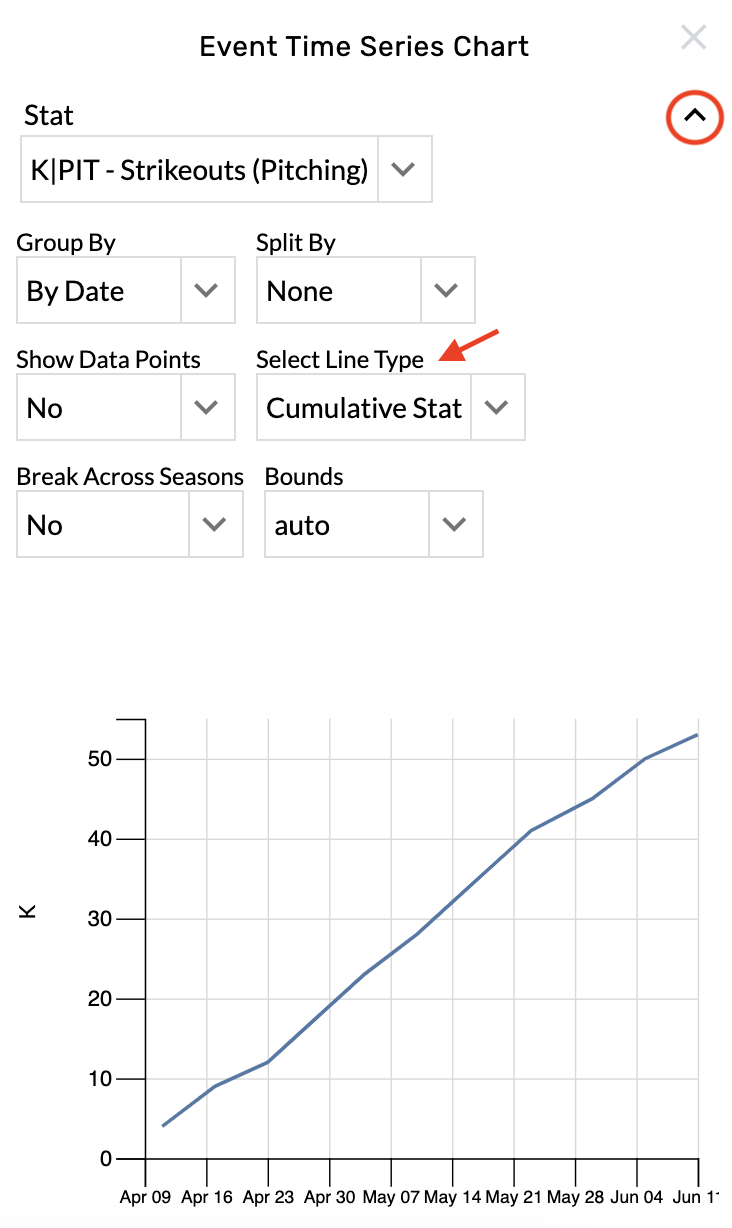
Change the line type
-
Open the graphic settings.
-
Choose from the Select Line Type menu.